Fig. 7
Download original image
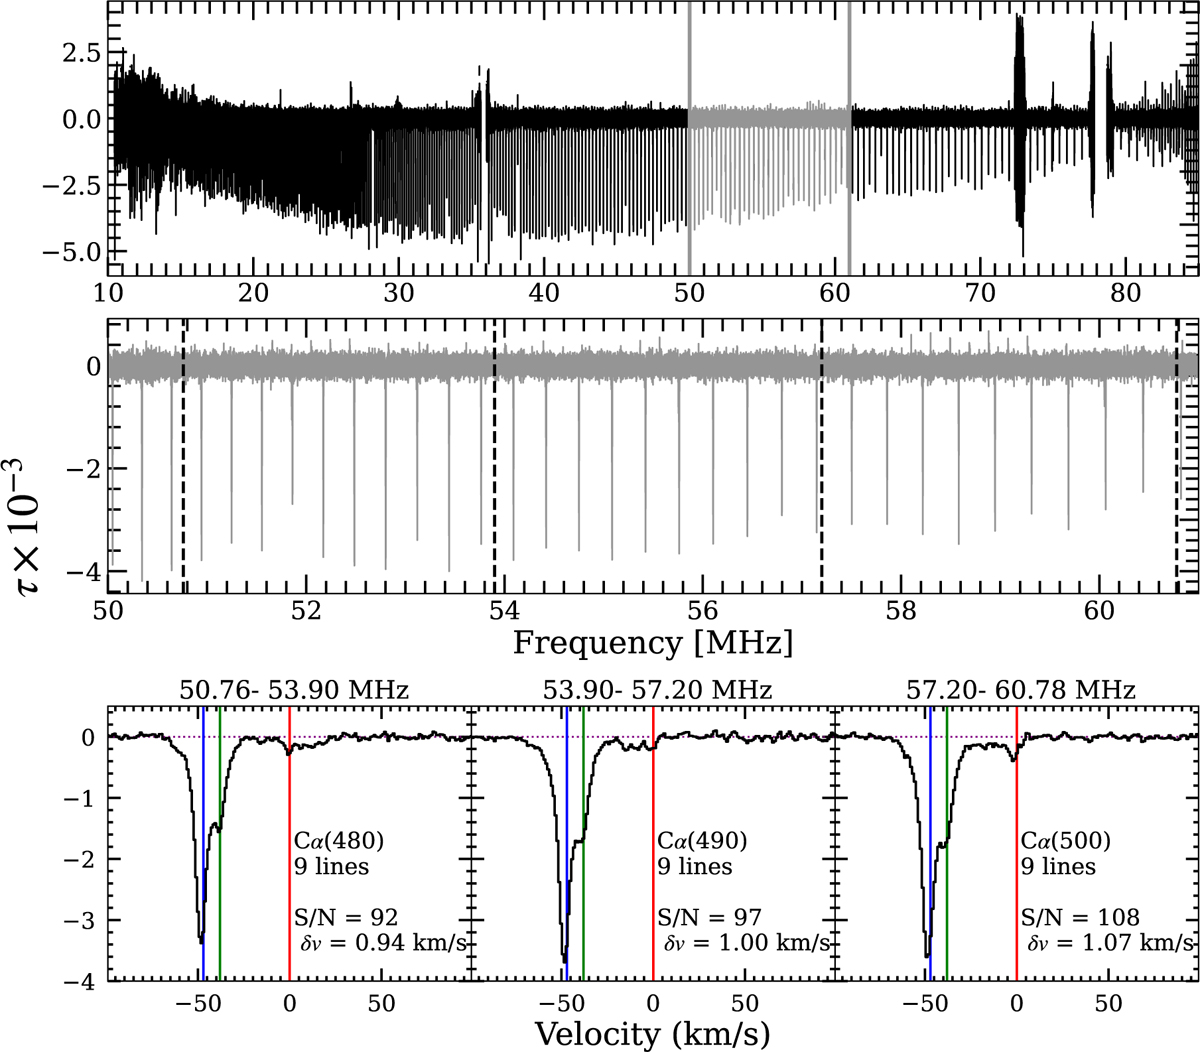
Post-processing of the data, on the example of Cassiopeia A. Top panel represents the whole spectrum averaged over all observing blocks. The gray area is an example of three stacking selections. Middle panel is a zoom on the gray area. Vertical dashed lines encompass the three selections of lines to be stacked. The vertical spikes are Cα RRLs. Bottom panel shows the three stacks computed from the selections. Stacking allows for the detection of three velocity components. Their expected positions are determined from previous studies (Oonk et al. 2014, 2017; Salas et al. 2017) and are marked by the vertical coloured lines: blue (−47 km s−1), green (−38 km s−1) and red (0 km s−1). The mean S/N for these three stacks is about ~100 at ~1 km s−1 resolution.
Current usage metrics show cumulative count of Article Views (full-text article views including HTML views, PDF and ePub downloads, according to the available data) and Abstracts Views on Vision4Press platform.
Data correspond to usage on the plateform after 2015. The current usage metrics is available 48-96 hours after online publication and is updated daily on week days.
Initial download of the metrics may take a while.