Fig. 8
Download original image
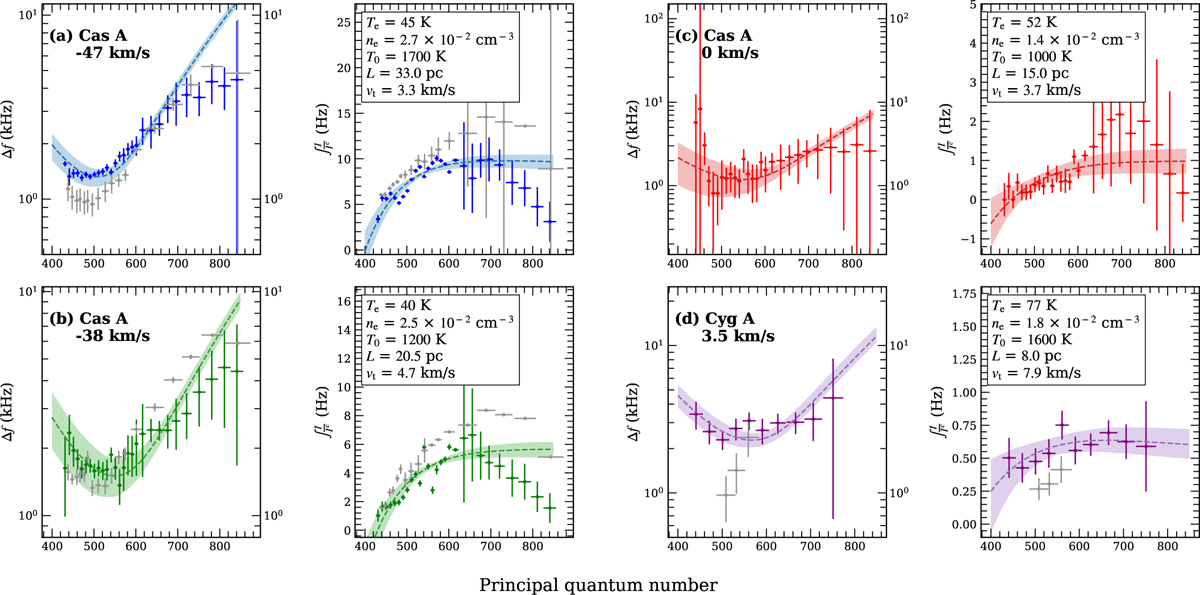
Fit results for the clouds detected towards Cas A and Cyg A. The coloured points correspond to NenuFAR data obtained through LT10. The gray points correspond to LOFAR Data from Oonk et al. (2014); Salas et al. (2017). The coloured areas correspond to uncertainty range, determined as every parameter set that gives a distance within the lowest 30%. The dashed and coloured lines are the models for the optimal parameters of the minimisation. The boxed parameters are the optimal values of the minimisation.
Current usage metrics show cumulative count of Article Views (full-text article views including HTML views, PDF and ePub downloads, according to the available data) and Abstracts Views on Vision4Press platform.
Data correspond to usage on the plateform after 2015. The current usage metrics is available 48-96 hours after online publication and is updated daily on week days.
Initial download of the metrics may take a while.