Fig. 9
Download original image
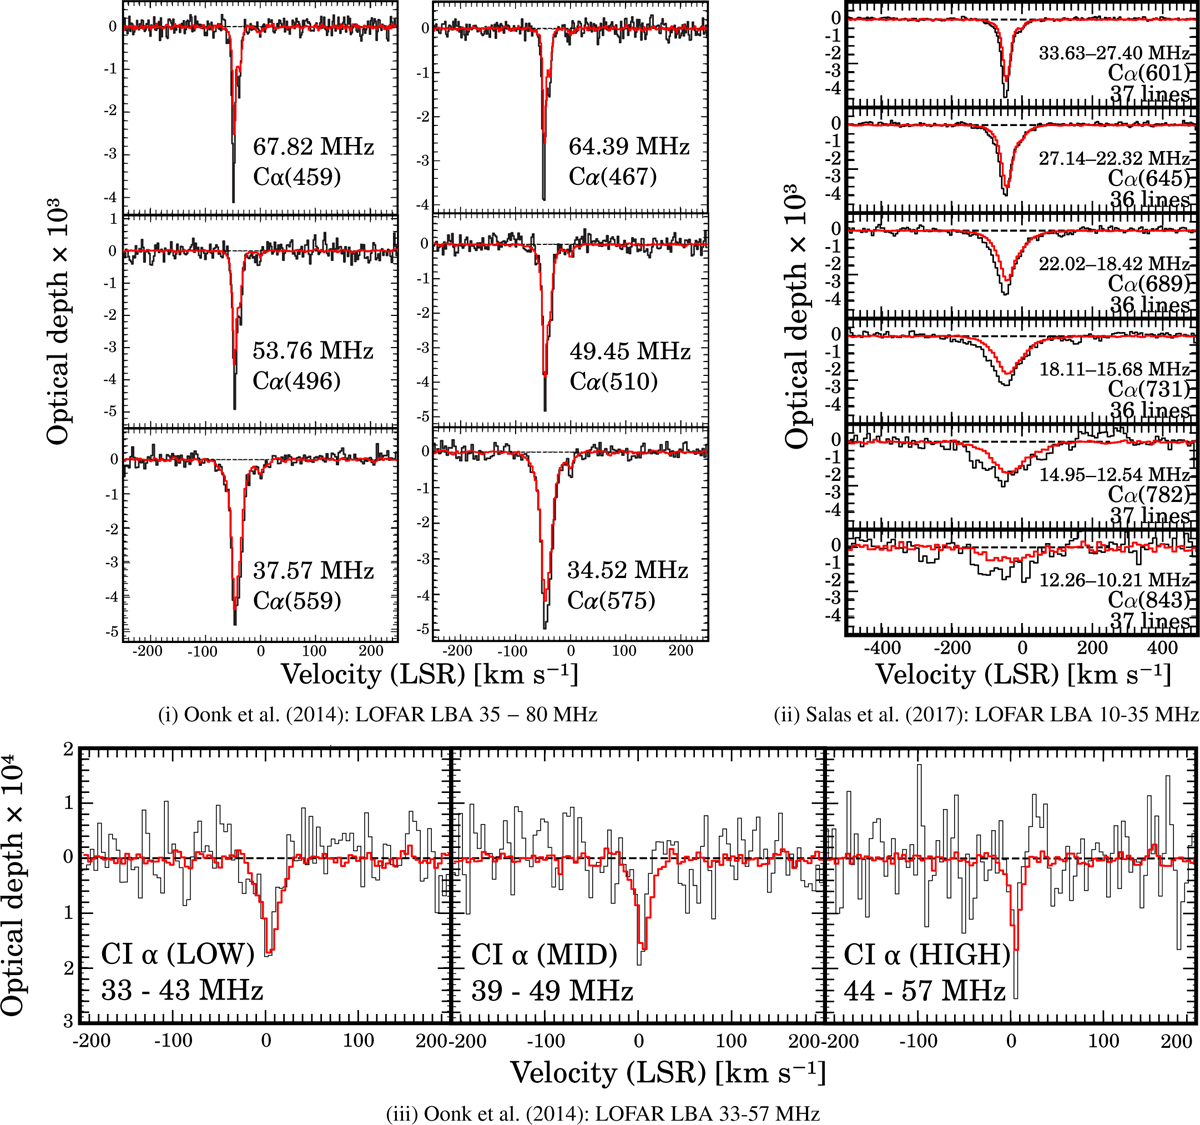
Overplot of the lines detected towards Cas A (Figs. 9i, 9ii) and Cyg A (Fig. 9iii) for LOFAR LBA (black) and NenuFAR (red). The panels in Fig. 9i compare the detections of LOFAR LBA in the frequency range ~35 to ~68 MHz, from Oonk et al. (2017). The panels in Fig. 9ii compare the detection of LOFAR LBA from ~10 to ~35 MHz, from Salas et al. (2017). The panels in Fig. 9iii compare the detection of LOFAR LBA from ~35 to ~57 MHz, from Oonk et al. (2014). The top panel (LOW) presents the detections of LOFAR LBA in the frequency range ~33 to ~43 MHz, the middle panel (MID) presents the detection from ~39 to ~49 MHz and the bottom panel (HIGH) is the detections from ~44 to ~57 MHz. The detections from NenuFAR were rebinned to the same velocity resolution as LOFAR, and the same transitions were included in the stacks.
Current usage metrics show cumulative count of Article Views (full-text article views including HTML views, PDF and ePub downloads, according to the available data) and Abstracts Views on Vision4Press platform.
Data correspond to usage on the plateform after 2015. The current usage metrics is available 48-96 hours after online publication and is updated daily on week days.
Initial download of the metrics may take a while.