Fig. 3.
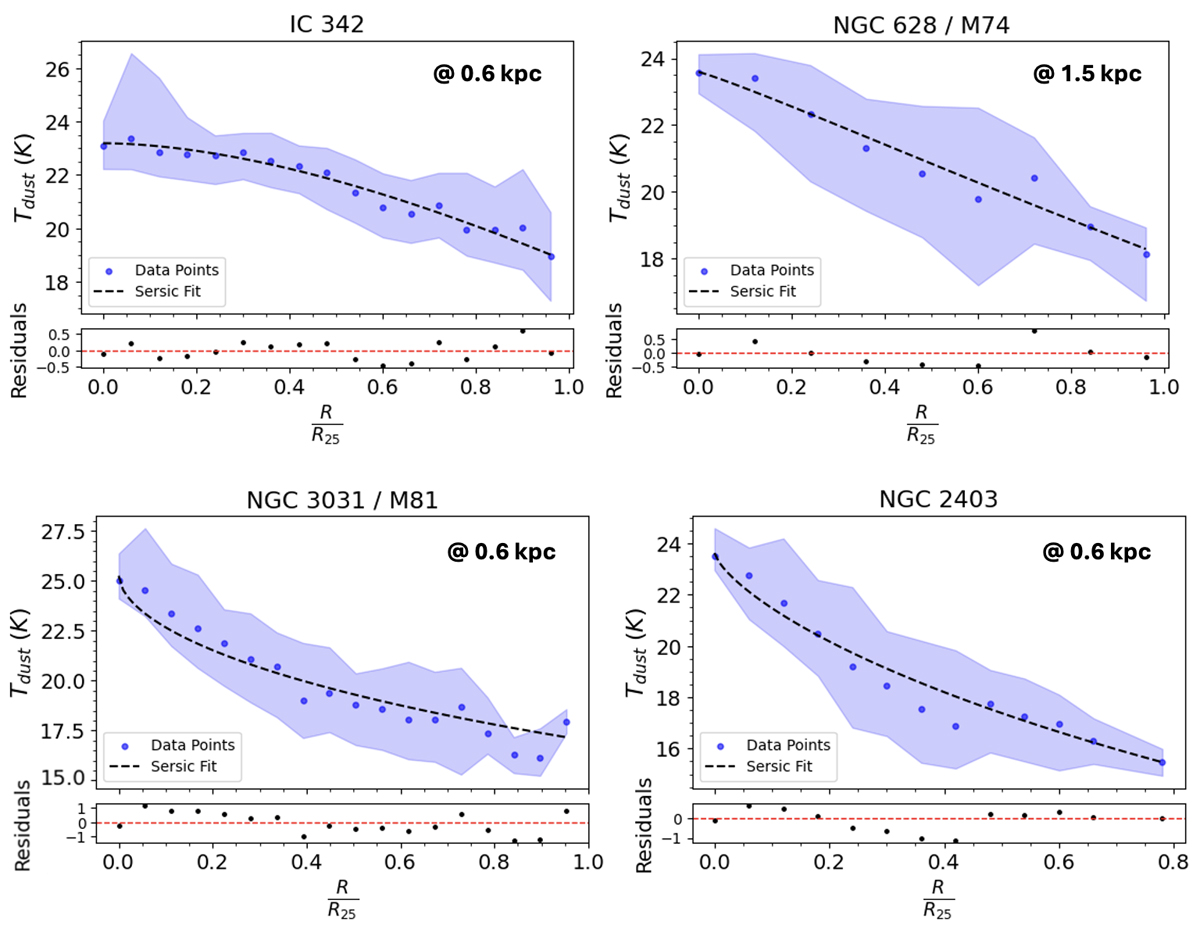
Download original image
Tdust radial profiles as a function of the galaxy radius normalised by R25 for some sample galaxies (IC 342, NGC 628, NGC 3031, NGC 2403). Median Tdust values are shown as blue points, with the shaded blue regions indicating the total uncertainties, computed as the quadrature sum of the 16th and 84th percentiles and the modelling uncertainties (see Sect. 3.1). The dashed black line represents the Sérsic profile fit (see Eq. 3 and Table 2). The sampled physical scale for each galaxy is quoted in its respective panel. The lower panels display the residuals relative to the Sérsic fit.
Current usage metrics show cumulative count of Article Views (full-text article views including HTML views, PDF and ePub downloads, according to the available data) and Abstracts Views on Vision4Press platform.
Data correspond to usage on the plateform after 2015. The current usage metrics is available 48-96 hours after online publication and is updated daily on week days.
Initial download of the metrics may take a while.