| Issue |
A&A
Volume 701, September 2025
|
|
|---|---|---|
| Article Number | A74 | |
| Number of page(s) | 16 | |
| Section | Extragalactic astronomy | |
| DOI | https://doi.org/10.1051/0004-6361/202555091 | |
| Published online | 02 September 2025 | |
The role of young and evolved stars in the heating of dust in local galaxies
1
INAF – Istituto di Radioastronomia, Via Gobetti 101, I-40129 Bologna, Italy
2
Dipartimento di Fisica e Astronomia, Alma Mater Studiorum Università di Bologna, Via Piero Gobetti 93/2, I-40129 Bologna, Italy
3
INAF – Osservatorio di Astrofisica e Scienza dello Spazio di Bologna, Via Gobetti 93/3, 40129 Bologna, Italy
4
INAF – Osservatorio Astrofisico di Arcetri, Largo E. Fermi 5, 50125 Florence, Italy
5
Dept. Física Teórica y del Cosmos, Universidad de Granada, Granada, Spain
6
Instituto Universitario Carlos I de Física Teórica y Computacional, Universidad de Granada, 18071 Granada, Spain
7
Instituto de Radioastronomía y Astrofísica (IRyA), Universidad Nacional Autónoma de México (UNAM), Antigua Carretera a Pátzcuaro, 8701, Ex-Hda. San José de la Huerta, Morelia, Michoacán 58089, Mexico
8
Université Paris-Saclay, Université Paris Cité, CEA, CNRS, AIM, 91191 Gif-sur-Yvette, France
9
Departamento de Física de la Tierra y Astrofísica, Fac. de C.C. Físicas, Universidad Complutense de Madrid, E-28040 Madrid, Spain
10
Instituto de Física de Partículas y del Cosmos, IPARCOS, Fac. C.C. Físicas, Universidad Complutense de Madrid, E-28040 Madrid, Spain
⋆ Corresponding author: This email address is being protected from spambots. You need JavaScript enabled to view it.
Received:
9
April
2025
Accepted:
14
July
2025
Abstract
Context. Dust is a fundamental component of the interstellar medium (ISM) and plays a critical role in shaping galaxy evolution. Dust grains influence the ISM by cooling the gas, altering its chemistry, absorbing stellar radiation, and re-emitting it at longer wavelengths in the FIR and submillimetre (sub-mm) regimes. The cold dust component, which constitutes the majority of the dust mass, is primarily heated by stellar radiation, with contributions from both young, massive stars and the diffuse emission from older stellar populations. It is essential to discern how dust is heated to better understand the relationship between stellar populations and their surrounding environments.
Aims. This study aims to identify the dominant heating mechanisms responsible for the cold dust component in typical nearby spiral galaxies and to explore the contributions of both young and evolved stellar populations to dust heating.
Methods. Using a sample of 18 large, face-on spiral galaxies from the DustPedia project, we employed two complementary approaches. In the first method, we studied the correlations between the dust temperature (Tdust), star-formation rate (SFR) surface density (ΣSFR), and stellar mass surface density (ΣM*). In the second method, we explored the relationship between Tdust and the dust mass surface density (Σdust).
Results. By analyzing the median temperature radial profile, we find that Tdust peaks at ∼24 K at the galaxy centre, decreasing to ∼15 K toward the galaxy outskirts. Our analysis shows similar Tdust in galaxies with and without a central active galactic nucleus (AGN), suggesting that AGN activity does not significantly influence Tdust values and distribution on the spatial scales covered by our data, which range from 0.3 to 3 kpc. For ∼72% of the galaxies in our sample, the methods consistently identify the primary dust heating source. However, when considering the entire galaxy sample, our analysis suggests that there is no single dominant heating mechanism. We find that both young and evolved stars contribute to dust heating, with their relative contributions varying across galaxies.
Key words: dust / extinction / galaxies: evolution / galaxies: general / galaxies: ISM / galaxies: spiral / galaxies: star formation
© The Authors 2025
 Open Access article, published by EDP Sciences, under the terms of the Creative Commons Attribution License (https://creativecommons.org/licenses/by/4.0), which permits unrestricted use, distribution, and reproduction in any medium, provided the original work is properly cited.
This article is published in open access under the Subscribe to Open model. This email address is being protected from spambots. You need JavaScript enabled to view it. to support open access publication.
1. Introduction
Interstellar dust comprises only ∼1% of the interstellar medium (ISM) by mass (e.g. Draine 2011), yet it has a significant impact on galaxy evolution by regulating heating, cooling, and chemistry. Dust grains are primarily produced in the ejecta of evolved stars, such as AGB stars and supernovae, and are subsequently injected into the ISM via stellar winds and explosive events (e.g. Gehrz 1989; Matsuura et al. 2009; Nanni et al. 2013, 2014; Dell’Agli et al. 2017; Ventura et al. 2018; Calura 2025). Once injected into the ISM, dust grains grow by accreting metals and coagulating into larger particles, but they can also be fragmented or destroyed by supernova-driven shocks (e.g. Jones et al. 1996; Hirashita & Aoyama 2019). Over time, energetic gas particles erode dust through sputtering, returning the material to the gas phase. These processes of formation, growth, and destruction highlight the role dust plays in the ISM cycle (e.g. Calura et al. 2008; Asano et al. 2013; Galliano et al. 2021).
Dust grains also affect the spectral energy distribution (SED) of galaxies by absorbing ultraviolet (UV) and optical light, then re-emitting it at longer wavelengths, in the infrared (IR) and submillimetre (sub-mm) range. The degree to which these processes affect the ISM is highly dependent on both the size and composition of the dust grains (e.g. Jones et al. 2017; Bianchi et al. 2019; Galliano 2022). Moreover, dust influences a galaxy’s metallicity, as a significant fraction of the metals produced through stellar nucleosynthesis is returned to the ISM via stellar mass loss or through SNe, condensing these metals into dust grains. As dust grains are composed of metals, their evolution is intrinsically linked to metallicity (e.g. Hu et al. 2023). Dust grains also play a pivotal role in catalysing the formation of molecular hydrogen (H2), the most abundant molecule in ISM. Dust protects H2 molecules from UV radiation that would otherwise cause their dissociation (e.g. Hollenbach & Salpeter 1971; Dwek 1987). In fact, molecular shielding is crucial in the SF process, as it allows the gas to cool down, leading to the development of high-density regions that are decisive in triggering the onset of SF (e.g. Kennicutt et al. 2007; Bigiel et al. 2011).
Dust grains in galaxies exhibit a range of temperatures, influenced by their size and the intensity of the radiation field to which they are exposed (Li & Draine 2001). Grains in thermal equilibrium can be heated by the diffuse radiation originating from both evolved stellar populations and young stars. However, when embedded in star-forming regions, they are primarily heated by intense radiation from newly formed UV-emitting stars, closely linked to recent SF (e.g. Nersesian et al. 2019). Small grains experience stochastic heating and can reach very high temperatures (up to 1000 K or more) due to single-photon absorption events, with their temperature depending on their size, composition, and the energy of the absorbed photon. In general, large grains, which dominate the dust mass in galaxies, reach relatively stable equilibrium temperatures of ∼15−30 K and predominantly emit in the far infrared (FIR), where they contribute to the majority of observed dust emission (e.g. Orellana et al. 2017; Pozzi et al. 2021).
The Herschel Space Observatory (Pilbratt et al. 2010), together with other space-based IR telescopes (e.g. Spitzer, Werner et al. 2004; WISE, Wright et al. 2010; JWST Gardner et al. 2006) has revolutionised our understanding of the ISM properties and, in particular, of the dust. Herschel observations have provided maps of dust emission with a resolution down to 6″–36″ over a broad wavelength range (70 − 500 μm), enabling detailed analyses of the fluxes, masses, and temperatures of dust within galaxies. Herschel observations have been crucial to investigations of the cold-dust component (T ∼ 15 − 20 K, Galliano et al. 2018), which does not emit significantly at shorter wavelengths (< 50 μm, Draine 2003). As a result, FIR observations are essential for probing the cold dust in nearby galaxies (e.g. Rémy-Ruyer et al. 2015; De Vis et al. 2019; Nersesian et al. 2021).
Thanks to Herschel, several efforts have been devoted to characterising dust in nearby galaxies. For example, Boselli et al. (2012) studied the relationships between different Herschel FIR colour indices and their connection with various physical properties of the galaxies. They concluded that the emission of the cold dust is regulated by the properties of the interstellar radiation field (ISRF), in addition to the gas-phase metallicity. Bendo et al. (2015) analyzed the variations in the 160/250 μm and 250/350 μm surface brightness ratios observed in a sample of nearby galaxies and compared them with tracers of SF and older stellar populations, identifying a broad variation in the heating of the dust observed in the 160−350 μm range. For some galaxies, they found evidence that emission at ≤160 μm originates from dust heated by star-forming regions; for others, the emission at ≥250 μm originates from dust heated by the older stellar population and in other cases, both stellar populations may contribute equally to the global dust heating or the results are inconclusive (see also, i.e. Smith et al. 2010; Hughes et al. 2014). Smith et al. (2012) analyzed Herschel observations of M 31 and found that dust in the bulge is primarily heated by evolved stars, with a weak correlation between dust temperature and SF in the outer disk. Similarly, Viaene et al. (2014) examined dust scaling relations in M 31, highlighting how dust content is regulated by stellar mass and SF history. More recently, Nersesian et al. (2019) and Bonato et al. (2024) found that dust heating in early-type galaxies is mainly due to old stars, whereas young stars progressively contribute more for spiral galaxies, although the contribution of old stars remains important, if not dominant.
Beyond empirical methods, radiative transfer (RT) models are essential for studying dust heating by simulating the propagation of photons through the ISM. These models account for complex geometries and varying optical depths, making them valuable for understanding radiation-dust interactions. For example, RT models such as SKIRT (Baes et al. 2011) utilise 3D Monte Carlo simulations to model absorption, scattering, and thermal emission of dust grains, allowing detailed studies of dust heating by different stellar populations (e.g. De Looze et al. 2014; Viaene et al. 2017; Nersesian et al. 2020a,b; Verstocken et al. 2020). Although complete RT simulations offer high precision, they can be computationally expensive and time-consuming.
In this context, the present study aims to understand the dominant heating source of the cold dust component in typical star-forming galaxies. We considered a subset of 18 large, nearby, face-on spiral galaxies from the DustPedia sample (Davies et al. 2017), as presented in Casasola et al. (2017, hereafter C17). We analyzed the dust properties (temperature and mass) and spatially resolved dust correlations, across a range of physical scales between 0.3 and 3.4 kpc. The correlations studied are between dust temperature (Tdust), dust mass surface density (Σdust), star-formation rate (SFR) surface density (ΣSFR), and stellar mass surface density (ΣM*). By analyzing these dust properties andcorrelations, we explored how different stellar populations and galaxy properties contribute to dust heating.
The structure of the paper is as follows. Section 2 describes the galaxy sample and the dataset used in this study. Section 3 presents the Tdust radial profiles derived for each sample galaxy and the average Tdust radial profile for the entire sample, with a focus on the contribution of the AGN to the heating of dust and analyse the dust correlations. Section 4 offers a discussion of the results and Sect. 5 summarises the study and proposes future perspectives.
2. Sample selection and dataset
The DustPedia project contains 875 apparently large (D251 > 1′) and nearby (≤40 Mpc) galaxies, all observed by Herschel. In addition to Herschel, the DustPedia project provides a comprehensive database of multi-wavelength imagery and photometry (from UV to radio), surpassing similar surveys in both wavelength coverage and the number of galaxies observed. The data used in this work come from the DustPedia database2 and C17 (see also, Davies et al. 2017; Clark et al. 2018, for a detailed description of the DustPedia sample and database).
The galaxies sample of C17 consists of sources with a sub-mm minor-to-major axis ratio (d/D)sub − mm ≥ 0.4 and sub-mm diameter Dsub − mm ≥ 9′, which corresponds to approximately 15 resolution elements in the SPIRE–500 μm maps (FWHM = 36″). These galaxies have a small (or moderate) inclination and have a diameter D25 ≥ 7.8′. The sample spans Hubble types from Sa to Sd and includes 3 Sa–Sab, 5 Sb–Sbc, and 10 Sc–Sd galaxies, some of which exhibit structural features such as bars or signs of interaction. Additionally, in our sample, 10 out of 18 galaxies are classified as low-luminosity active galactic nuclei (AGNs, LX < 1042 erg s−1), including Seyferts and low-ionisation nuclear emission-line regions (LINERs). In contrast, the remaining ones have a HII nucleus. However, for our analysis, we considered only Seyferts (4 galaxies) as AGNs, since the energetic contribution from LINERs to dust heating is expected to be minimal (see Sect. 3.2). The exception is NGC 300, for which no nuclear classification is available. Table 1 lists the main properties of the galaxy sample (for details on the sample, see C17).
Main properties of the sample galaxies.
In this study, we used Σdust, ΣSFR, and ΣM* maps from C17. As a novelty, we introduced Tdust maps, not present in C17 but produced following the same methodology and assumptions used for Σdust. All maps have been corrected for inclination, i.
2.1. Dust temperature and dust mass surface density
Physical dust models assume specific compositions, densities, and shapes for dust grains, adopting heat capacities and optical properties from laboratory and/or theoretical studies (Draine & Li 2007; Jones et al. 2013). While earlier models have often assumed spherical grains for simplicity, more recent models account for elongated grains (e.g. Draine & Hensley 2023; Ysard et al. 2024). The temperature and emission of large grains in thermal equilibrium with a radiation field can be semi-analytically estimated, however, numerical integration is required over realistic absorption efficiencies. These physical models are calibrated by adjusting the grain size distribution and dust mass per H to simultaneously match observations of extinction, emission, and abundance, typically in a high-latitude Milky Way cirrus, where the underlying radiation field that is responsible for dust heating is known (e.g. Mathis et al. 1983; Bianchi et al. 2017).
Here, we recall the main steps used in the derivation of Σdust and Tdust maps of Casasola et al. (2017). The dust properties and grain size distributions were taken from the Heterogeneous dust Evolution Model for Interstellar Solids (THEMIS)3 dust model (Jones et al. 2013, 2017; Köhler et al. 2014), which (as in the case of other physical dust models) assumes that dust emission originates from grains exposed to a local ISRF, parameterised by the intensity, U, where U = 1 corresponds to the Solar neighborhood ISRF. Within THEMIS, the dust grains consist of amorphous hydrocarbon (a-C(:H)) and amorphous olivine-type and pyroxene-type silicate with iron and iron sulfide nanoinclusions (a-Sil (Fe, FeS)), with silicates coated in a-C(:H) mantles (Ysard et al. 2015). This dust model successfully reproduces the observed extinction, IR-to-mm thermal emission, and sub-mm opacity of Milky Way dust (e.g. Fanciullo et al. 2015; Ysard et al. 2015).
The Σdust and U maps were obtained by fitting observed SEDs at each position within a galaxy, with the modelled SEDs convolved with Herschel filter response functions. Dust emission for a range of U values was computed using DustEM software (Compiègne et al. 2011). The radiation field, U, was modelled as a single uniform ISRF, following a simplified version of the Draine & Li (2007) approach. This method assumes most of the dust mass is heated by a single diffused component (U = Umin, in the notation of their method), with negligible contributions from higher-intensity components (see Dale et al. 2012; Aniano et al. 2012; Bianchi 2013). The spectral shape of the ISRF is fixed to that of the local Solar neighborhood (Mathis et al. 1983), as is customary in SED fits based on the Draine & Li (2007) approach. Although this does not account for possible spectral hardening or reddening in different regions, such variations primarily affect the MIR regime and have a limited impact on the FIR-to-sub-mm range used for our fits (see also, Draine et al. 2021; Bianchi et al. 2022). The SED fitting was performed using Herschel bands with λ ≥ 160 μm (PACS 160 μm, SPIRE 250, 350, 500 μm). When available, PACS 100 μm data were included and PACS 70 μm fluxes were treated as upper limits to exclude transiently heated grains Rémy-Ruyer et al. (2013). For more information on the fitting process, refer to C17. Tdust is not directly derived from the SED fit, but calculated using the ISRF strength, parameterised by U (Aniano et al. 2012).
 (1)
(1)
where T0 = 18.3 K represents the Tdust in the solar neighborhood (Mathis et al. 1983), while β = 1.79 is the dust emissivity index adopted from the THEMIS model, which was fixed at this value throughout the analysis. Physically, variations in β can reflect differences in the intrinsic properties of dust grains, such as their composition and structure, while statistically, variations in β influence the best-fit Tdust values, with higher β generally leading to lower Tdust estimates (Kelly et al. 2012). This reflects an anti-correlation between the two parameters that can arise during the fitting process.
In this work, a single Tdust value was assigned to each position within the galaxy, although in reality, Tdust may vary within a resolution element due to multiple local heating sources. Figure 1 shows the Σdust (left panel) and Tdust (right panel) maps derived for the galaxy NGC 3031 (M 81). This figure shows that NGC 3031 exhibits a strong depletion of Σdust toward the galaxy centre, while Tdust increases. As NGC 3031 is situated in a dense environment and interacts with at least two neighboring galaxies (M 82 and NGC 3077, e.g. Kaufman et al. 1989; Davidge 2008), it is plausible that this galaxy was affected by recent encounters or merger events (e.g. Mattsson & Andersen 2012). These events can substantially erode the dust, causing a central decline. The low dust mass content in the central region of NGC 3031 is consistent with the very weak CO emission observed in the same region (e.g. Solomon et al. 1987; Brouillet et al. 1988; Sakamoto et al. 2001; Casasola et al. 2007). For this reason, NGC 3031 is considered to be an example of a prototypically CO-poor galaxies, as is Andromeda (M 31, e.g. Nieten et al. 2006) or the centre of NGC 7331 (e.g. Tosaki & Shioya 1997) to a lesser extent. The increase in Tdust toward the centre of NGC 3031 could be attributed to different causes, such as an AGN that is present in this galaxy (see Table 1).
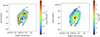 |
Fig. 1. Σdust (left) and Tdust (right) maps of the sample galaxy NGC 3031 (M 81) derived according to the prescriptions described in Sect. 2.1. The maps are shown at the SPIRE-500 resolution (36″), corresponding to 0.6 kpc at the galaxy’s distance. Only regions with S/N > 5 are shown. |
2.2. Stellar mass and star-formation rate surface density
Here, we recall the main steps used in the derivation of ΣM* and ΣSFR maps of C17. The ΣM* maps were derived using IRAC 3.6 μm and 4.5 μm images, following the method of Querejeta et al. (2015), based on independent component analysis (ICA; Meidt et al. 2012). In nearby galaxies, the old stellar population is the main source of the IRAC 3.6 μm and 4.5 μm fluxes, although additional contributions may occur. For example, due to the finite bandwidth of the instrument, non-stellar features, such as the 3.3 μm PAH emission feature and the PAH continuum, could contaminate these bands (Flagey et al. 2006). The ICA enables us to separate the dominant stellar emission from these other contributions without prior assumptions of their relative strengths. This technique results in a clean, smooth map of the old stellar light, consistent with expectations for an old, dust-free stellar population. For more details on implementing ICA to obtain stellar mass, refer to Querejeta et al. (2015).
The ΣSFR maps were derived by combining the GALEX-FUV and WISE 22 μm data, according to the calibration of Bigiel et al. (2008). Originally, Bigiel et al. (2008) used Spitzer 24 μm emission, instead of WISE 22 μm. The GALEX-FUV data primarily trace O and early B stars, making it a good indicator of SF activity. However, FUV wavelengths are strongly affected by dust, which absorbs FUV light and re-radiates it at longer wavelengths in the mid-IR. To account for dust attenuation, the 22 μm (or 24 μm) flux densities are used to correct the FUV luminosity. The ΣSFR was estimated from GALEX–FUV emission corrected by the WISE 22 μm emission using the following calibration:
 (2)
(2)
where ΣSFR is in units of M⊙ yr−1 kpc−2, and I22 and IFUV are the 22 μm and FUV intensities, respectively, in units of MJy sr−1. This calibration is based on the initial mass function (IMF) from Calzetti et al. (2007). This combined SFR calibration, together with others (e.g. Hα + 24 μm, Kennicutt et al. 2007; Calzetti et al. 2007), is widely used for SFR studies of nearby galaxies (e.g. Rahman et al. 2011; Ford et al. 2013; Momose et al. 2013; Casasola et al. 2017, 2022; Muraoka et al. 2019; Yajima et al. 2021). Figure 2 shows, as an example, the ΣM* (left panel) and ΣSFR (right panel) maps derived for the galaxy NGC 3031 (M 81). For more information on the derivation of the Tdust, Σdust, ΣM*, and ΣSFR maps, refer to C17.
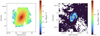 |
Fig. 2. Same as Fig. 1 for ΣM* (left) and ΣSFR maps (right) of the sample galaxy NGC 3031 (M 81) derived according to the prescriptions described in Sect. 2.2. Only regions with S/N > 2 are shown. |
All the maps used in this analysis (Σdust, Tdust, ΣM*, ΣSFR) were originally convolved to a common angular resolution of 36″ (the FWHM of SPIRE-500 μm beam) using PSF-matching convolution kernels from Aniano et al. (2011). The resulting maps were initially sampled at a pixel scale of 12″, corresponding to 1/3 of the SPIRE-500 beam size. However, to avoid artificial correlations arising from oversampling and to ensure that each pixel represents an approximately independent resolution element, we rebinned all maps to a final pixel size of 36″, matching the beam FWHM. This rebinned set of maps was used for all subsequent pixel-by-pixel correlation analyses. In addition, all DustPedia images used here have been processed to remove Galactic foreground stars, following the approach described in Clark et al. (2018) and C17. This was accomplished using the Python Toolkit for SKIRT (Camps & Baes 2015; Verstocken et al. 2017), which performs automated stellar source removal.
We note that one of the galaxies in our sample, NGC 5194 (also known as M 51a), belongs to an interacting system with its companion galaxy NGC 5195. Consequently, the physical properties derived for NGC 5194 may be influenced by contamination from the stellar populations of NGC 5195. Surface brightness profiles from FUV to 500 μm presented in C17 show that this contamination mainly affects the older stellar component, while its impact on tracers of young stars is expected to be negligible. This view is reinforced by the 3D radiative transfer modelling of the NGC 5194–NGC 5195 pair by Nersesian et al. (2020b), who mapped the radiation fields of both galaxies and quantified the energy exchange within the system. Their model reveals that NGC 5195 contributes only 5.8% to the total dust heating of the system. Nevertheless, in the regions of NGC 5194 close to NGC 5195, this influence is stronger, with the fraction of absorbed energy reaching 38%. In contrast, on the outer disc of NGC 5194, the contribution from NGC 5195 falls below 1%.
3. Results
3.1. Dust temperature radial profile
In this section, we examine the Tdust radial profiles for our galaxy sample. We construct these profiles using the Tdust maps presented in Sect. 2.1. Each galaxy’s map Tdust map is divided into concentric rings to extract the radial profile. We adopt a fixed radial binwidth equal to 36″, corresponding to the pixel scale of our maps. The number of radial bins varies depending on galaxy size, ranging from 9 bins for the smallest galaxies to 19 bins for the largest galaxies in our sample. For each ring, the radial distance of each pixel is computed, and the Tdust values within the ring (between ri and ri + 1) are used to determine the median Tdust. Uncertainties in the median Tdust values are calculated as the quadrature sum of the 16th and 84th percentiles and the SED fitting uncertainties. The average uncertainty in SED fitting across all galaxies is 0.5 K, with a range spanning from 0.1 − 2.3 K. The radial distances are normalised by the optical radius R25, enabling consistent comparisons of profiles across galaxies of different sizes.
The Tdust radial profiles were fitted using a Sérsic function, expressed as
 (3)
(3)
where a is a scaling factor that represents the central Tdust, while b quantifies the steepness of the Tdust gradient and c determines the profile’s curvature. The fitting was performed using the function curve_fit of Scipy PYTHON module (Virtanen et al. 2020).
The Sérsic fit parameters for all galaxies in our sample are summarised in Table 2. Examples of the individual Tdust radial profiles for galaxies IC 342, NGC 628 (M 74), NGC 3031 (M 81), and NGC 2403, along with their respective fits, are shown in Fig. 3. Appendix A displays Tdust radial profiles of the entire sample. To obtain a more general trend of how Tdust decreases with radius, we computed a median Tdust profile by combining the normalised radial profiles of all galaxies, sampled at the same interval. At each sampled radial point, the median Tdust across all galaxies was calculated, along with the 16th and 84th percentiles, to provide a measure of the scatter. This approach results in a representative Tdust radial profile for the entire sample, capturing the overall trend and variations. The average Tdust radial profile is shown in the panel a of Fig. 4, while the best-fit Sérsic parameters for this median profile are presented in Table 3. The average Tdust profile is well reproduced by the Sérsic function, with a reduced chi-squared χred2 value of 0.984 and an associated p-value of ≤0.001 indicating a very good fit. The Tdust peaks at ∼24 K in the galaxy centre and it decreases down to ∼15 K at a radius of approximately R25.
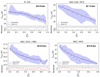 |
Fig. 3. Tdust radial profiles as a function of the galaxy radius normalised by R25 for some sample galaxies (IC 342, NGC 628, NGC 3031, NGC 2403). Median Tdust values are shown as blue points, with the shaded blue regions indicating the total uncertainties, computed as the quadrature sum of the 16th and 84th percentiles and the modelling uncertainties (see Sect. 3.1). The dashed black line represents the Sérsic profile fit (see Eq. 3 and Table 2). The sampled physical scale for each galaxy is quoted in its respective panel. The lower panels display the residuals relative to the Sérsic fit. |
We also explored whether the presence of a bar influences the Tdust radial profiles by separating the barred galaxies (SAB-SB) and the unbarred galaxies and reproducing the median profiles, shown in panels b and c of Fig. 4. We found no significant differences in the Tdust profiles due to the bar. Although we would have liked to examine the differences between interacting and non-interacting galaxies, nearly all galaxies in our sample are classified by NED4 as members of groups with varying degrees of interaction, which limits our ability to conduct thiscomparison.
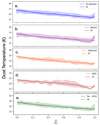 |
Fig. 4. Panel a shows the median Tdust radial profile for all galaxies in our sample (blue). Panels b and c display the median Tdust profiles for barred (SAB-SB, purple) and unbarred (orange) galaxies, respectively. The panels d and e show the median Tdust profiles for AGN galaxies (red) and non-AGN (green) galaxies, respectively. The Tdust radial profiles are plotted as a function of the galaxy radius normalised by R25. The dashed line represents the fitted Sérsic profile (see Eq. 3), with the corresponding parameters listed in Table 3. |
3.2. AGN contribution to the temperature radial profile
Overall, AGNs are known to significantly influence the ISM through both radiative and mechanical feedback mechanisms (AGN-driven winds, outflows, and jets), thereby affecting the thermal and chemical processes of various ISM components (e.g. Fabian 2012; Kirkpatrick et al. 2015; Viaene et al. 2020; McKinney et al. 2021). In particular, the optical/UV AGN emission can be absorbed by the surrounding circum-nuclear dust, which is then heated, producing strong emissions in the mid-infrared (MIR) spectrum (e.g. Fritz et al. 2006; Pozzi et al. 2012; Alonso-Herrero et al. 2021). The question of how the AGN affects the colder and more diffuse dust component and enhances or decreases the FIR emission is still a matter of debate, with studies on high-z galaxies reaching different conclusions (e.g. Mullaney et al. 2012; Santini et al. 2012; Lanzuisi et al. 2017). In the Local Universe, a number of studies have explored the contribution of AGNs to dust heating, with their findings varying based on AGN luminosity and other galaxy-specific factors. For example, Mullaney et al. (2011) highlighted how moderate-luminosity AGNs can contribute significantly to the dust’s IR emission. Meanwhile, Dicken et al. (2023) showed that AGNs can heat dust at FIR wavelengths, with correlations observed between AGN power indicators and thermal emission from cool dust.
Furthermore, RT simulation studies have suggested that AGNs significantly contribute to the heating of diffused dust in the host galaxy, particularly in regions close to the central AGN (Duras et al. 2017). This role is most evident in the central regions, where AGNs can strongly influence Tdust profiles. For example, Schneider et al. (2015) used RT simulations to investigate the IR properties of high-z quasars (z ∼ 6), demonstrating that AGN radiation can be a significant source of dust heating in the host galaxy, powering at least 30% and up to 70% of the observed FIR emission.
Although both LINERs and Seyfert galaxies fall under the AGN category, their effects on dust heating differ. LINERs are characterised by low radiative efficiency and accretion rates, which result in weaker ionising radiation compared to Seyferts (e.g. Macchetto & Chiaberge 2007; Ho 2008). This results in LINERs, which are typically associated with weaker ionising radiation and older stellar populations, exhibiting a minimal impact on dust heating, as they lack the intense UV and X-ray output required to significantly affect Tdust beyond the immediate nuclear regions. In contrast, Seyferts exhibit stronger radiation fields and higher luminosities, which can elevate Tdust to a larger spatial extent. Given these aspects, we chose to focus our analysis exclusively on Seyfert galaxies to assess the AGN-driven heating of cold dust. Thus, in the following discussion, we use ‘AGN’ to refer only to Seyfert galaxies, while galaxies identified as LINERs or HII regions are grouped as ‘no AGN’. Among our sample, two galaxies have an ambiguous nuclear classification. NGC 5236 (classified as HII/LINER) is included in the ‘no AGN’ group, while NGC 3621 (classified as LINER/Seyfert) is included in the ‘AGN’ category to evaluate possible AGN-related effects on dust heating.
To investigate whether AGNs contribute to dust heating in galaxies in our sample, we compared the average Tdust radial profiles of galaxies with and without AGNs. The results of this analysis are shown in the panels d and e of Fig. 4. We did not find any significant difference between AGN and non-AGN galaxies. This suggests that the contribution of AGNs to dust heating (if indeed present) is not observable at the spatial resolution of our data, ranging from 0.3 to 3 kpc. This also indicates that the influence of AGN on dust heating is restricted to very small spatial scales and is therefore likely to be diluted when averaged over the larger spatial regions investigated in this study.
This finding is consistent with the results of Esposito et al. (2022), who also found no evidence for the influence of AGN on the cold and low-density molecular gas on the kpc scales in a sample of 35 local active galaxies. Additionally, Viaene et al. (2020) used a 3D RT modelling approach to the low-luminosity AGN hosted in NGC 1068 and found that the contribution of the AGN to the heating of dust is negligible on global scales, with significant heating confined to the inner few hundred parsecs.
3.3. Stellar dust heating mechanisms
Stellar populations contribute to dust heating through various mechanisms. Three primary factors regulate the efficiency of dust grain heating: (1) the spatial distribution of stars within a specific population relative to the dust distribution in the galaxy; (2) the spectrum of different stellar populations, which determines their capacity to heat surrounding dust grains; and (3) the topology of the ISM. These factors collectively shape the ISRF of the galaxy, which is responsible for dust grains heating. Understanding the interaction between the energy emitted by different stellar populations and dust grains is essential for understanding galaxy evolution.
To identify the primary heating mechanism of cold dust, we used two methods. In the first, we studied the correlations of Tdust with ΣSFR and ΣM*. In the second, we explored the relationship of Tdust with Σdust, as outlined by Utomo et al. (2019).
3.3.1. Correlating dust temperature with star-formation rate and stellar mass
Studying the correlations of Tdust with ΣSFR and ΣM* is a tool to understand the link between Tdust and different stellar populations. Young, massive stars are the main contributors to the heating of dust in active star-forming regions and can be traced by ΣSFR. These stars have a characteristic timescale of about 100 Myr, which is the timescale traced by FUV emission. In contrast, evolved stars contribute to the heating of dust in more quiescent regions and can be traced by ΣM*. Once we derived Tdust, ΣSFR, and ΣM* maps for all sample galaxies according to the prescriptions presented in Sect. 2, we were able to study the pixel-by-pixel Tdust − ΣSFR and Tdust − ΣM* correlations using weighted Pearson correlation coefficients. We focused on the region within the optical disk defined by R25. This choice provides a normalisation scale that is commonly used in the literature (e.g. C17, Casasola et al. 2020, 2022; Enia et al. 2020; Morselli et al. 2020).
Figure 5 shows an example of the Tdust − ΣSFR and Tdust − ΣM* correlations for two sample galaxies (NGC 2403 and NGC 5055) and Table 4 presents the weighted Pearson correlation coefficients5, r, of the correlations for the entire sample. The r coefficients range from moderate to high values for both correlations, indicating that both SF activity and old stars contribute to dust heating. However, our analysis shows that in nearly half of the sample (56%, 10 out of 18 galaxies), the young stellar population dominates the dust heating process, as indicated by a higher Pearson correlation coefficient for the Tdust − ΣSFR relation compared to the Tdust − ΣM* relation. In the remaining galaxies, the evolved stellar population is the dominant contributor.
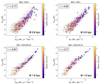 |
Fig. 5. Examples of the pixel-by-pixel Tdust − ΣSFR (left panels) and Tdust − ΣM* (right panels) correlations for two sample galaxies (NGC 2403 and NGC 5055). The colour bar represents the galaxy radius. The weighted Pearson correlation coefficient r (top-left corner) and the sampled physical scale (bottom-right corner) are quoted in the panels. |
Correlation coefficients and p-values for each sample galaxy.
3.3.2. Probing dust heating with Σdust and Tdust
In this section, we investigate the contribution of young stellar populations to dust heating following the method developed by Utomo et al. (2019). In this method, a precise correlation between Σdust and Tdust is expected under the hypothesis that young stars are the dominant dust heating mechanism. We summarise the main steps of the method below.
The main assumption of this method is that the entire IR luminosity (LIR) arises from the reprocessed radiation of young stars and therefore LIR can be used as a tracer of SFR. This implies that LIR surface density (ΣLIR) can be linked to ΣSFR as ΣLIR ∝ ΣSFR. By using the Kennicutt–Schmidt (KS) relation (Schmidt 1959, 1963; Kennicutt 1998a,b), which is the correlation between ΣSFR and gas mass surface density (Σgas, ΣSFR ∝ Σgasn), and assuming a linear relationship between Σdust and Σgas (Σgas ∝ Σdust), we can express the following:
 (4)
(4)
In addition, Utomo et al. (2019) assumed that the dust is in thermal equilibrium with the radiation, described by a modified black body (MBB) function, and it is optically thin. This implies that LIR can be expressed as:
 (5)
(5)
where κν is the dust absorption cross section per unit mass. Following a standard approach, κν is assumed to be a power law (Draine 2011), given by:  , where β is the emissivity index, and κ0 is the opacity at reference frequency ν0. By performing the integral in frequency, this yields
 (6)
(6)
Equation (6) can be expressed in terms of logarithm as:
 (7)
(7)
where A is a constant that encapsulates all proportionality constants, including geometrical factors. In our analysis, we evaluated Eq. (7) by adopting β = 1.79 (see Sect. 2.1), n = 2.19 derived by Casasola et al. (2022) studying the pixel-by-pixel KS relation for galaxies of our sample at the common resolution of 3.4 kpc, and the constant CO-to-H2 conversion factor XCO = N(H2)/ICO = 2 × 1020 cm−2 (K km s−1) derived by Bolatto et al. (2013)6.
We tested the Utomo method by producing the pixel-by-pixel correlation between log Tdust and logΣdust for each sample galaxy and by fitting it with Eq. (7). Any deviation of the observed correlations from the trend expected by the Utomo method may suggest that LIR does not completely arise from the reprocessed radiation of young stars but other sources could contribute, such as older stellar populations and/or AGN activity.
To ensure the robustness of our results and to minimise the effects of correlated uncertainties, we restrict our analysis to pixels with a signal-to-noise ratio (S/N) greater than 5 for both the Tdust and Σdust maps. At a lower S/N, uncertainties in the simultaneous derivation of Tdust and Σdust can become correlated, leading to an apparent anti-correlation between the two parameters. This occurs because a higher Tdust can be compensated by a lower dust mass to match the observed emission. Moreover, we also impose a threshold on Σdust, taking into account only pixels with log Σdust [M⊙ pc−2] > −1.5. This threshold was chosen to exclude regions where too low values of Σdust could introduce additional uncertainties.
For each sample galaxy, we performed a chi-square (χ2) fitting of the observed data versus the expected values from the relation between log Tdust and logΣdust. The key indicator in this χ2-test is the p-value, which quantifies how likely it is that our data are aligned with Eq. (7) by chance. We adopted a significance level of α = 0.05. For a given galaxy, a p-value below α indicates that the observed relationship between Tdust and Σdust aligns with the trend expected by Utomo et al. (2019); therefore, the dust heating is mainly due to young stellar populations. In contrast, a p-value exceeding α implies that the assumption of dust heating mainly due to young stars does not hold, but other sources (e.g. older stars) contribute to it in a non-negligible way.
Figure 6 presents the results of our analysis for two representative galaxies among the sample (NGC 3621 and NGC 5055), while Appendix B shows the corresponding results for the remaining galaxies. These two cases illustrate the diversity within our sample: NGC 3621, with a p-value of 0.014, exhibits Tdust and Σdust values that closely follow the trend reported by Utomo et al. (2019); whereas NGC 5055, with a p-value of 1.000, significantly deviates from that relation. In our sample of 18 galaxies, approximately 72% (13 galaxies) have a p-value exceeding the significance threshold of α = 0.05, indicating that young stars are not the sole contributors to dust heating in these systems. Instead, other sources, most likely evolved stellar populations, appear to play a significant role in powering the observed IR emission. These results support a scenario where the heating of cold dust is not exclusively linked to recent SF but is also shaped by other processes that reflect the specific physical conditions of each galaxy.
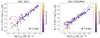 |
Fig. 6. Pixel-by-pixel relation between log Tdust and logΣdust according to Eq. (7) for two sample galaxies (NGC 3621 and NGC 5055). Blue points represent the mean values within each bin, with error bars indicating the standard deviation in each bin. The black line corresponds to the expected relation (see Eq. 7). The colour bar represents the galaxy radius. The sampled physical scale for each galaxy is quoted in its respective panel. |
4. Discussion
Our analysis highlights that dust heating is influenced by both young and evolved stellar populations, with the dominant source varying by galaxy type. The plot in Fig. 7 illustrates this, with the x-axis representing the correlation coefficient between Tdust and ΣSFR and the y-axis between Tdust and ΣM*. The black dashed reference line divides the plot into regions where Tdust is more strongly influenced by either young stars (traced by ΣSFR) or evolved stars (traced by ΣM*). Galaxies above the line have a stronger correlation between Tdust and ΣM*, where evolved stars likely dominate dust heating. In contrast, galaxies below the line exhibit a stronger correlation with SFR, suggesting that young stars are the dominant source of dust heating. However, we note that points located near the dashed line may correspond to cases where the first method provides a less reliable separation of the heating contributions.
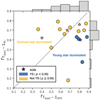 |
Fig. 7. Pearson correlation coefficient r of the Tdust − ΣSFR relation vs that of the Tdust − ΣM* relation. AGN galaxies are marked with stars, non-AGN galaxies with circles. The galaxies are colour-coded according to the p-values of the χ2 test (see Sect. 3.3.2): blue symbols to p < 0.05 (aligned with the young star-driven heating assumption: YS) and orange symbols correspond to p ≥ 0.05 (deviation from the young star heating assumption: not YS). The black dashed line represents the 1:1 relation. The grey histograms in the margins show the distributions of the correlation coefficients for Tdust − ΣSFR (top) and Tdust − ΣM* (right). |
In Fig. 7, the symbols are colour-coded based on the results of the second method (Tdust − Σdust correlation). Table 5 compares the dominant dust heating mechanism determined by the two methods based on r and p-value for the first and second methods, respectively.
Dust heating mechanisms derived from both methods for each sample galaxy. “YS” = young stars; “ES” = evolved stars. AGN hosts are indicated by an asterisk (*).
Out of the 18 galaxies analyzed, the two methods yield consistent results in 13 cases (∼72%). While the overall agreement is good, discrepancies are found in the following galaxies: NGC 5457, NGC 628, NGC 5055, NGC 4725, and NGC 3521. These disagreements may stem from various combined reasons. For instance, discrepancies could be due to resolution effects. Coarse resolution may indeed blend SFRs with the diffused ISM, leading to an averaging effect that obscures localised heating mechanisms. In addition, we assume a constant slope (n = 2.19, see Sect. 3.3.2) for the KS law across all galaxies (Casasola et al. 2022). Although this slope value has been derived for the same galaxy sample at the common resolution of 3.4 kpc, Casasola et al. (2022) also showed that the KS slope varies galaxy-by-galaxy and as a function of resolution. This suggests that specific physical conditions and SF efficiencies could influence the KS relation and a single slope may not fully capture these variations. Importantly, the adopted slope of n = 2.19 itself relies on assumptions about the gas mass, including the use of a constant CO-to-H2 conversion factor when estimating molecular gas from CO emission. Variations in this factor can directly affect the derived KS slope, introducing additional uncertainties. It is well known that the CO-to-H2 conversion factor varies across galaxies and within galaxies (e.g. Bolatto et al. 2013). Previous studies, such as that of Rémy-Ruyer et al. (2013), have reported a trend between the colour temperature and metallicity, indicating that low-metallicity (12 + log(O/H) ≲ 8.3) systems7 tend to have hotter Tdust, likely due to a stronger contribution from heating by young stars. In these low-metallicity environments, the CO-to-H2 conversion factor might be higher, potentially leading to a different distribution of dust heating mechanisms compared to higher metallicity galaxies. The assumption of a constant the CO-to-H2 conversion factor could therefore mask the metallicity-dependent variations in heating, contributing to some discrepancies observed in our analysis. Another possible source of discrepancy between the two methods is the assumption of a linear relationship between Σdust and Σgas (see Sect. 3.3.2). Variations in the dust-to-gas mass ratio (DGR) have been observed and mainly attributed to changes in gas-phase metallicity, grain growth, or destruction mechanisms.
Our findings are aligned with previous studies, such as that of Nersesian et al. (2019), where the CIGALE energy balance code was used to investigate dust heating sources on a global scale. Their analysis of Herschel data from the DustPedia project revealed that in spiral galaxies, young stars contribute up to ∼77% of their luminosity to dust heating, while older stars contribute to ∼24%. While these results reflect the dominant role of young stars in global heating, the contribution from evolved stellar populations is still significant. The recent findings of Paspaliaris et al. (2023) have reinforced this trend, providing a detailed breakdown of dust heating contributions in different galaxy types using the GAMA survey. Their study found that star-forming Sa-Scd galaxies exhibit a dominant contribution from young stars, with 59% of their luminosity used for dust heating, while older stars contribute only 16%. They found similar contributions even in the case of quiescent Sa-Scd, suggesting that residual SF continues to play a role. Viaene et al. (2017) studied the Andromeda galaxy (M 31) to examine dust heating mechanisms, finding that the majority of dust heating (∼91%) of the absorbed luminosity is driven by evolved stellar populations. This finding further supports the idea that older stellar populations play an important role in dust heating on a galactic scale.
Several galaxies in our sample were also studied using RT models in other works. M 51 was analyzed by De Looze et al. (2014), Nersesian et al. (2020b), and Inman et al. (2023); M 81 by Verstocken et al. (2020), NGC 1365 by Nersesian et al. (2020a), NGC 628 by Rushton et al. (2022), and M 101 by Pricopi et al. (2025). These studies found that young stars contribute to dust-heating between ∼50% and ∼75% of the total heating. For instance, in M 51, different RT models estimate the fraction of dust heating from young stars to range from 63% to 72%, while in M 81, the heating is nearly evenly split between young and old stellar populations. These findings highlight that galaxy morphology, stellar content, and variations in SF activity can significantly influence the relative contributions of young and evolved stars to dust heating, underlining the importance of considering these factors when interpreting dust heating on galactic scales.
Our findings also support recent results from Chastenet et al. (2025). Although their integrated measurements showed no correlation between the average radiation field intensity and stellar mass, their resolved analysis revealed a strong correlation between Umin and ΣM* in a sample of ∼800 nearby galaxies. Their findings suggest that evolved stars maintain a consistent radiation field across the galaxy disk, contributing significantly to dust heating. This is further corroborated by studies from Bendo et al. (2012, 2015) and Bonato et al. (2024), who similarly observed that young stars are primarily responsible for heating in active star-forming regions, whereas older stars offer more consistent background heating. A recent work by Chiang et al. (2023) further investigated the relationship between Tdust and various galaxy properties for a sample of 46 nearby galaxies. They found a strong correlation between Tdust and ΣSFR, emphasising the role of young stars in dust heating. Furthermore, they found that for galaxies with similar ΣSFR, an increased DGR leads to a lower Tdust, likely due to enhanced shielding of dust in regions with a higher dust mass. Collectively, these findings emphasise the dual role of young and evolved stars: while young stars dominate localised heating in star-forming regions, older stars provide a baseline heating effect that is consistent and widespread.
5. Conclusions
In this study, we analysed a sample of 18 large, nearby, face-on spiral galaxies from the DustPedia project to identify the dominant mechanisms for heating the cold dust component, traced by Herschel, in these systems. Here, we compare two methods. In the first method, we studied the pixel-by-pixel correlations between Tdust and ΣSFR (tracer of young stars) and between Tdust and ΣM* (tracer of old stars). In the second method, we analysed the pixel-by-pixel correlation between Tdust and Σdust. Our data sample physical scales from 0.3 to 3 kpc. Our main results are as follows:
-
The Tdust radial profiles show a decline from ∼24 K at the galaxy centre to ∼15 K at R25, which is well described by the Sérsic function.
-
The presence of a central AGN does not significantly influence the Tdust radial profiles on the spatial scales sampled by our data.
-
The analysis of the correlations between Tdust and ΣSFR and between Tdust and ΣM* (first method) suggests that both young stars and evolved stars contribute to dust heating. In 56% of the galaxies, Tdust shows a stronger correlation with ΣSFR, indicating the dominant role of young stars in dust heating in star-forming regions.
-
The analysis of the correlation between Tdust and Σdust (second method) shows that for the ∼72% of the sample, young stars are not unique contributors to dust heating and other sources (e.g. evolved stars) can play a role.
-
Out of the 18 galaxies analyzed, the two methods are consistent in 13 cases (∼72%). The discrepancies between the two methods may be due to different combined factors, including resolution effects, the assumption of a constant value for the slope of the KS relation and for the CO-to-H2 conversion factor, and the assumption of a linear relationship between Σdust and Σgas.
Our study strongly outlines the need for statistical samples of galaxies with the SED properly sampled in the FIR-to-sub-mm part of the spectrum, for the purpose of an advanced characterisation of the dust temperature and dust mass. This will be achieved by exploiting the synergies between sub-mm/mm (i.e. ALMA, NOEMA) and future space FIR facilities such as the forthcoming PRIMA telescope (PI: G.J. Glenn)8. Moreover, the gas-phase metallicity is absent in our analysis, although it represents an important element of the ISM. However, the Metal-THINGS survey (Lara-López et al. 2021) is generating resolved metallicity information for most galaxies of our sample, which will allow us to take into account the variation in the metallicity within galaxy disks and its effect on dust and gas. This will be the subject of an incoming paper (Tailor et al., in prep.).
D25 is the major axis isophote at which the optical surface brightness falls beneath 25 mag arcsec−2 (this is the diameter of the galaxy if it is a disk). We also use R25 = D25/2.
Typically, if 0 < |r|< 0.3, the correlation is defined as weak; if 0.3 ≤ |r|< 0.7, as moderate; and if |r|≥0.7, as strong. Additionally, one common interpretation of the correlation coefficient r is that its square, r2, represents the fraction of the variation in one variable that can be explained by the other. For example, an r value of 0.50 between Tdust and ΣSFR means that 25% of the variation in Tdust can be explained by ΣSFR.
The CO-to-H2 conversion factor expressed in terms of αCO corresponds to αCO = M(H2)/LCO = 3.2 M⊙ pc−2 (K km s−1)−1 (Narayanan et al. 2012).
We point out that our sample is characterised by a ‘normal’ metallicity, with values of 8.3 ≤ 12 + log(O/H) ≤ 8.8, based on the empirical metallicity calibration N2 of Pettini & Pagel (2004) (see Casasola et al. 2022, for details on metallicity of the sample).
Acknowledgments
The authors thank the anonymous referee for his/her constructive comments and valuable suggestions, which helped improve the quality and clarity of the manuscript. We thank Fabrizio Gentile for his input and suggestions regarding the data analysis and statistical methods. This research has made use of the NASA/IPAC Extragalactic Database (NED), which is funded by the National Aeronautics and Space Administration and operated by the California Institute of Technology. VC, FP, FC, and SB acknowledge funding from the INAF Mini Grant 2022 program “Face-to-Face with the Local Universe: ISM’s Empowerment (LOCAL)”. F. Galliano acknowledges support by the French National Research Agency under the contract WIDEN- ING ANR-23-ESDIR-0004, as well as by the Programme National “Physique et Chimie du Milieu In- terstellaire” (PCMI) of CNRS/INSU, with INC and INP, and the “Programme National Cosmologie et Galaxies” (PNCG) of CNRS/INSU, with INP and IN2P3, both programs being co-funded by CEA and CNES. MR acknowledges support from project PID2023-150178NB-I00 (and PID2020-114414GB-I00), financed by MCIU/AEI/10.13039/501100011033, and by FEDER, UE.
References
- Alonso-Herrero, A., García-Burillo, S., Hönig, S. F., et al. 2021, A&A, 652, A99 [NASA ADS] [CrossRef] [EDP Sciences] [Google Scholar]
- Aniano, G., Draine, B. T., Gordon, K. D., & Sandstrom, K. 2011, PASP, 123, 1218 [Google Scholar]
- Aniano, G., Draine, B. T., Calzetti, D., et al. 2012, ApJ, 756, 138 [Google Scholar]
- Asano, R. S., Takeuchi, T. T., Hirashita, H., & Inoue, A. K. 2013, Earth Planets Space, 65, 213 [NASA ADS] [CrossRef] [Google Scholar]
- Baes, M., Verstappen, J., De Looze, I., et al. 2011, ApJS, 196, 22 [Google Scholar]
- Baldi, R. D., Williams, D. R. A., McHardy, I. M., et al. 2023, Vizier Online Data Catalog: J/MNRAS/500/4749 [Google Scholar]
- Bendo, G. J., Boselli, A., Dariush, A., et al. 2012, MNRAS, 419, 1833 [NASA ADS] [CrossRef] [Google Scholar]
- Bendo, G. J., Baes, M., Bianchi, S., et al. 2015, MNRAS, 448, 135 [NASA ADS] [CrossRef] [Google Scholar]
- Bianchi, S. 2013, A&A, 552, A89 [NASA ADS] [CrossRef] [EDP Sciences] [Google Scholar]
- Bianchi, S., Giovanardi, C., Smith, M. W. L., et al. 2017, A&A, 597, A130 [NASA ADS] [CrossRef] [EDP Sciences] [Google Scholar]
- Bianchi, S., Casasola, V., Baes, M., et al. 2019, A&A, 631, A102 [NASA ADS] [CrossRef] [EDP Sciences] [Google Scholar]
- Bianchi, S., Casasola, V., Corbelli, E., et al. 2022, A&A, 664, A187 [NASA ADS] [CrossRef] [EDP Sciences] [Google Scholar]
- Bigiel, F., Leroy, A., Walter, F., et al. 2008, AJ, 136, 2846 [NASA ADS] [CrossRef] [Google Scholar]
- Bigiel, F., Leroy, A. K., Walter, F., et al. 2011, ApJ, 730, L13 [NASA ADS] [CrossRef] [Google Scholar]
- Bolatto, A. D., Wolfire, M., & Leroy, A. K. 2013, ARA&A, 51, 207 [CrossRef] [Google Scholar]
- Bonato, M., Baronchelli, I., Casasola, V., et al. 2024, Galaxies, 12, 37 [Google Scholar]
- Boselli, A., Ciesla, L., Cortese, L., et al. 2012, A&A, 540, A54 [NASA ADS] [CrossRef] [EDP Sciences] [Google Scholar]
- Brouillet, N., Baudry, A., & Combes, F. 1988, A&A, 196, L17 [NASA ADS] [Google Scholar]
- Calura, F., Pipino, A., & Matteucci, F. 2008, A&A, 479, 669 [NASA ADS] [CrossRef] [EDP Sciences] [Google Scholar]
- Calura, F. 2025, Interstellar dust production, destruction and effects of dust depletion in galaxies, arXiv e-prints [arXiv:2506.13851] [Google Scholar]
- Calzetti, D., Kennicutt, R. C., Engelbracht, C. W., et al. 2007, ApJ, 666, 870 [Google Scholar]
- Camps, P., & Baes, M. 2015, Astron. Comput., 9, 20 [Google Scholar]
- Casasola, V., Combes, F., Bettoni, D., & Galletta, G. 2007, A&A, 473, 771 [NASA ADS] [CrossRef] [EDP Sciences] [Google Scholar]
- Casasola, V., Cassarà, L. P., Bianchi, S., et al. 2017, A&A, 605, A18 [NASA ADS] [CrossRef] [EDP Sciences] [Google Scholar]
- Casasola, V., Bianchi, S., De Vis, P., et al. 2020, A&A, 633, A100 [NASA ADS] [CrossRef] [EDP Sciences] [Google Scholar]
- Casasola, V., Bianchi, S., Magrini, L., et al. 2022, A&A, 668, A130 [NASA ADS] [CrossRef] [EDP Sciences] [Google Scholar]
- Chastenet, J., Sandstrom, K., Leroy, A. K., et al. 2025, ApJS, 276, 2 [Google Scholar]
- Chiang, I.-D., Hirashita, H., Chastenet, J., et al. 2023, MNRAS, 520, 5506 [CrossRef] [Google Scholar]
- Clark, C. J. R., Verstocken, S., Bianchi, S., et al. 2018, A&A, 609, A37 [NASA ADS] [CrossRef] [EDP Sciences] [Google Scholar]
- Compiègne, M., Verstraete, L., Jones, A., et al. 2011, A&A, 525, A103 [Google Scholar]
- Dale, D. A., Aniano, G., Engelbracht, C. W., et al. 2012, ApJ, 745, 95 [NASA ADS] [CrossRef] [Google Scholar]
- Davidge, T. J. 2008, PASP, 120, 1145 [Google Scholar]
- Davies, J. I., Baes, M., Bianchi, S., et al. 2017, PASP, 129, 044102 [NASA ADS] [CrossRef] [Google Scholar]
- De Looze, I., Fritz, J., Baes, M., et al. 2014, A&A, 571, A69 [NASA ADS] [CrossRef] [EDP Sciences] [Google Scholar]
- De Vis, P., Jones, A., Viaene, S., et al. 2019, A&A, 623, A5 [NASA ADS] [CrossRef] [EDP Sciences] [Google Scholar]
- Dell’Agli, F., García-Hernández, D. A., Schneider, R., et al. 2017, MNRAS, 467, 4431 [Google Scholar]
- Dicken, D., Tadhunter, C. N., Nesvadba, N. P. H., et al. 2023, MNRAS, 519, 5807 [Google Scholar]
- Draine, B. T. 2003, ARA&A, 41, 241 [NASA ADS] [CrossRef] [Google Scholar]
- Draine, B. T. 2011, Physics of the Interstellar and Intergalactic Medium (Princeton: Princeton University Press) [Google Scholar]
- Draine, B. T., & Hensley, B. S. 2023, ApJ, 947, 92 [Google Scholar]
- Draine, B. T., & Li, A. 2007, ApJ, 657, 810 [CrossRef] [Google Scholar]
- Draine, B. T., Li, A., Hensley, B. S., et al. 2021, ApJ, 917, 3 [CrossRef] [Google Scholar]
- Duras, F., Bongiorno, A., Piconcelli, E., et al. 2017, A&A, 604, A67 [NASA ADS] [CrossRef] [EDP Sciences] [Google Scholar]
- Dwek, E. 1987, ApJ, 322, 812 [NASA ADS] [CrossRef] [Google Scholar]
- Enia, A., Rodighiero, G., Morselli, L., et al. 2020, MNRAS, 493, 4107 [NASA ADS] [CrossRef] [Google Scholar]
- Esposito, F., Vallini, L., Pozzi, F., et al. 2022, MNRAS, 512, 686 [NASA ADS] [CrossRef] [Google Scholar]
- Fabian, A. C. 2012, ARA&A, 50, 455 [Google Scholar]
- Fanciullo, L., Guillet, V., Aniano, G., et al. 2015, A&A, 580, A136 [NASA ADS] [CrossRef] [EDP Sciences] [Google Scholar]
- Flagey, N., Boulanger, F., Verstraete, L., et al. 2006, A&A, 453, 969 [NASA ADS] [CrossRef] [EDP Sciences] [Google Scholar]
- Ford, G. P., Gear, W. K., Smith, M. W. L., et al. 2013, ApJ, 769, 55 [Google Scholar]
- Fritz, J., Franceschini, A., & Hatziminaoglou, E. 2006, MNRAS, 366, 767 [Google Scholar]
- Galliano, F. 2022, Habilitation Thesis, Université Paris-Saclay [Google Scholar]
- Galliano, F., Galametz, M., & Jones, A. P. 2018, ARA&A, 56, 673 [Google Scholar]
- Galliano, F., Nersesian, A., Bianchi, S., et al. 2021, A&A, 649, A18 [EDP Sciences] [Google Scholar]
- Gardner, J. P., Mather, J. C., Clampin, M., et al. 2006, Space Sci. Rev., 123, 485 [Google Scholar]
- Gehrz, R. 1989, IAU Symp., 135, 445 [Google Scholar]
- Goulding, A. D., & Alexander, D. M. 2009, MNRAS, 398, 1165 [NASA ADS] [CrossRef] [Google Scholar]
- Hirashita, H., & Aoyama, S. 2019, MNRAS, 482, 2555 [NASA ADS] [CrossRef] [Google Scholar]
- Ho, L. C. 2008, ARA&A, 46, 475 [Google Scholar]
- Hollenbach, D., & Salpeter, E. E. 1971, ApJ, 163, 155 [NASA ADS] [CrossRef] [Google Scholar]
- Hu, C.-Y., Sternberg, A., & van Dishoeck, E. F. 2023, ApJ, 952, 140 [NASA ADS] [CrossRef] [Google Scholar]
- Hughes, T. M., Baes, M., Fritz, J., et al. 2014, A&A, 565, A4 [NASA ADS] [CrossRef] [EDP Sciences] [Google Scholar]
- Inman, C. J., Popescu, C. C., Rushton, M. T., & Murphy, D. 2023, MNRAS, 526, 118 [Google Scholar]
- Jones, A. P., Tielens, A. G. G. M., & Hollenbach, D. J. 1996, ApJ, 469, 740 [Google Scholar]
- Jones, A. P., Fanciullo, L., Köhler, M., et al. 2013, A&A, 558, A62 [NASA ADS] [CrossRef] [EDP Sciences] [Google Scholar]
- Jones, A. P., Köhler, M., Ysard, N., Bocchio, M., & Verstraete, L. 2017, A&A, 602, A46 [NASA ADS] [CrossRef] [EDP Sciences] [Google Scholar]
- Kaufman, M., Bash, F. N., Hine, B., et al. 1989, ApJ, 345, 674 [Google Scholar]
- Kelly, B. C., Shetty, R., Stutz, A. M., et al. 2012, ApJ, 752, 55 [NASA ADS] [CrossRef] [Google Scholar]
- Kennicutt, R. C., Jr. 1998a, ARA&A, 36, 189 [Google Scholar]
- Kennicutt, R. C., Jr. 1998b, ApJ, 498, 541 [Google Scholar]
- Kennicutt, R. C., Jr., Calzetti, D., Walter, F., et al. 2007, ApJ, 671, 333 [Google Scholar]
- Kirkpatrick, A., Pope, A., Sajina, A., et al. 2015, ApJ, 814, 9 [NASA ADS] [CrossRef] [Google Scholar]
- Köhler, M., Jones, A., & Ysard, N. 2014, A&A, 565, L9 [NASA ADS] [CrossRef] [EDP Sciences] [Google Scholar]
- Lanzuisi, G., Delvecchio, I., Berta, S., et al. 2017, A&A, 602, A123 [NASA ADS] [CrossRef] [EDP Sciences] [Google Scholar]
- Lara-López, M. A., Zinchenko, I. A., Pilyugin, L. S., et al. 2021, ApJ, 906, 42 [CrossRef] [Google Scholar]
- Li, A., & Draine, B. T. 2001, ApJ, 554, 778 [Google Scholar]
- Macchetto, F. D., & Chiaberge, M. 2007, IAU Symp., 238, 273 [Google Scholar]
- Mathis, J. S., Mezger, P. G., & Panagia, N. 1983, A&A, 128, 212 [NASA ADS] [Google Scholar]
- Matsuura, M., Barlow, M. J., Zijlstra, A. A., et al. 2009, MNRAS, 396, 918 [NASA ADS] [CrossRef] [Google Scholar]
- Mattsson, L., & Andersen, A. C. 2012, MNRAS, 423, 38 [NASA ADS] [CrossRef] [Google Scholar]
- McKinney, J., Hayward, C. C., Rosenthal, L. J., et al. 2021, ApJ, 921, 55 [CrossRef] [Google Scholar]
- Meidt, S. E., Schinnerer, E., Knapen, J. H., et al. 2012, ApJ, 744, 17 [NASA ADS] [CrossRef] [Google Scholar]
- Menezes, R. B., Steiner, J. E., Ricci, T. V., & da Silva, P. 2022, MNRAS, 513, 5935 [NASA ADS] [CrossRef] [Google Scholar]
- Momose, R., Koda, J., Kennicutt, R. C., Jr., et al. 2013, ApJ, 772, L13 [CrossRef] [Google Scholar]
- Morselli, L., Rodighiero, G., Enia, A., et al. 2020, MNRAS, 496, 4606 [NASA ADS] [CrossRef] [Google Scholar]
- Mullaney, J. R., Alexander, D. M., Goulding, A. D., & Hickox, R. C. 2011, MNRAS, 414, 1082 [Google Scholar]
- Mullaney, J. R., Pannella, M., Daddi, E., et al. 2012, MNRAS, 419, 95 [NASA ADS] [CrossRef] [Google Scholar]
- Muraoka, K., Sorai, K., Miyamoto, Y., et al. 2019, PASJ, 71, S15 [NASA ADS] [CrossRef] [Google Scholar]
- Nanni, A., Bressan, A., Marigo, P., & Girardi, L. 2013, MNRAS, 434, 2390 [NASA ADS] [CrossRef] [Google Scholar]
- Nanni, A., Bressan, A., Marigo, P., & Girardi, L. 2014, MNRAS, 438, 2328 [NASA ADS] [CrossRef] [Google Scholar]
- Narayanan, D., Krumholz, M. R., Ostriker, E. C., & Hernquist, L. 2012, MNRAS, 421, 3127 [NASA ADS] [CrossRef] [Google Scholar]
- Nersesian, A., Xilouris, E. M., Bianchi, S., et al. 2019, A&A, 624, A80 [NASA ADS] [CrossRef] [EDP Sciences] [Google Scholar]
- Nersesian, A., Verstocken, S., Viaene, S., et al. 2020a, A&A, 637, A25 [NASA ADS] [CrossRef] [EDP Sciences] [Google Scholar]
- Nersesian, A., Viaene, S., De Looze, I., et al. 2020b, A&A, 643, A90 [NASA ADS] [CrossRef] [EDP Sciences] [Google Scholar]
- Nersesian, A., Dobbels, W., Xilouris, E. M., et al. 2021, MNRAS, 506, 3986 [NASA ADS] [CrossRef] [Google Scholar]
- Nieten, C., Neininger, N., Guélin, M., et al. 2006, A&A, 453, 459 [CrossRef] [EDP Sciences] [Google Scholar]
- Orellana, G., Nagar, N. M., Elbaz, D., et al. 2017, A&A, 602, A68 [NASA ADS] [CrossRef] [EDP Sciences] [Google Scholar]
- Paspaliaris, E. D., Xilouris, E. M., Nersesian, A., et al. 2023, A&A, 669, A11 [NASA ADS] [CrossRef] [EDP Sciences] [Google Scholar]
- Pejcha, O., & Prieto, J. L. 2015, ApJ, 799, 215 [NASA ADS] [CrossRef] [Google Scholar]
- Pettini, M., & Pagel, B. E. J. 2004, MNRAS, 348, L59 [NASA ADS] [CrossRef] [Google Scholar]
- Pilbratt, G. L., Riedinger, J. R., Passvogel, T., et al. 2010, A&A, 518, L1 [NASA ADS] [CrossRef] [EDP Sciences] [Google Scholar]
- Pozzi, F., Vignali, C., Gruppioni, C., et al. 2012, MNRAS, 423, 1909 [Google Scholar]
- Pozzi, F., Calura, F., Fudamoto, Y., et al. 2021, A&A, 653, A84 [NASA ADS] [CrossRef] [EDP Sciences] [Google Scholar]
- Pricopi, D., Popescu, C. C., Rushton, M. T., et al. 2025, MNRAS, 537, 56 [Google Scholar]
- Querejeta, M., Meidt, S. E., Schinnerer, E., et al. 2015, ApJS, 219, 5 [NASA ADS] [CrossRef] [Google Scholar]
- Rahman, N., Bolatto, A. D., Wong, T., et al. 2011, ApJ, 730, 72 [NASA ADS] [CrossRef] [Google Scholar]
- Rémy-Ruyer, A., Madden, S. C., Galliano, F., et al. 2013, A&A, 557, A95 [Google Scholar]
- Rémy-Ruyer, A., Madden, S. C., Galliano, F., et al. 2015, A&A, 582, A121 [Google Scholar]
- Rushton, M. T., Popescu, C. C., Inman, C., Natale, G., & Pricopi, D. 2022, MNRAS, 514, 113 [Google Scholar]
- Sabbi, E., Calzetti, D., Ubeda, L., et al. 2018, ApJS, 235, 23 [Google Scholar]
- Sakamoto, K., Fukuda, H., Wada, K., & Habe, A. 2001, AJ, 122, 1319 [NASA ADS] [CrossRef] [Google Scholar]
- Santini, P., Rosario, D. J., Shao, L., et al. 2012, A&A, 540, A109 [NASA ADS] [CrossRef] [EDP Sciences] [Google Scholar]
- Schmidt, M. 1959, ApJ, 129, 243 [NASA ADS] [CrossRef] [Google Scholar]
- Schmidt, M. 1963, Nature, 197, 1040 [Google Scholar]
- Schneider, R., Bianchi, S., Valiante, R., Risaliti, G., & Salvadori, S. 2015, A&A, 579, A60 [NASA ADS] [CrossRef] [EDP Sciences] [Google Scholar]
- Smith, M. W. L., Vlahakis, C., Baes, M., et al. 2010, A&A, 518, L51 [NASA ADS] [CrossRef] [EDP Sciences] [Google Scholar]
- Smith, M. W. L., Eales, S. A., Gomez, H. L., et al. 2012, ApJ, 756, 40 [Google Scholar]
- Solomon, P. M., Rivolo, A. R., Barrett, J., & Yahil, A. 1987, ApJ, 319, 730 [Google Scholar]
- Thomas, A. D., Dopita, M. A., Shastri, P., et al. 2017, ApJS, 232, 11 [NASA ADS] [CrossRef] [Google Scholar]
- Tosaki, T., & Shioya, Y. 1997, ApJ, 484, 664 [Google Scholar]
- Tully, R. B., Courtois, H. M., & Sorce, J. G. 2016, AJ, 152, 50 [Google Scholar]
- Utomo, D., Chiang, I.-D., Leroy, A. K., Sandstrom, K. M., & Chastenet, J. 2019, ApJ, 874, 141 [NASA ADS] [CrossRef] [Google Scholar]
- Ventura, P., Karakas, A., Dell’Agli, F., García-Hernández, D. A., & Guzman-Ramirez, L. 2018, MNRAS, 475, 2282 [NASA ADS] [Google Scholar]
- Verstocken, S., Van De Putte, D., Camps, P., & Baes, M. 2017, Astron. Comput., 20, 16 [NASA ADS] [CrossRef] [Google Scholar]
- Verstocken, S., Nersesian, A., Baes, M., et al. 2020, A&A, 637, A24 [NASA ADS] [CrossRef] [EDP Sciences] [Google Scholar]
- Viaene, S., Fritz, J., Baes, M., et al. 2014, A&A, 567, A71 [NASA ADS] [CrossRef] [EDP Sciences] [Google Scholar]
- Viaene, S., Baes, M., Tamm, A., et al. 2017, A&A, 599, A64 [NASA ADS] [CrossRef] [EDP Sciences] [Google Scholar]
- Viaene, S., Nersesian, A., Fritz, J., et al. 2020, A&A, 638, A150 [NASA ADS] [CrossRef] [EDP Sciences] [Google Scholar]
- Virtanen, P., Gommers, R., Oliphant, T. E., et al. 2020, Nat. Meth., 17, 261 [Google Scholar]
- Werner, M. W., Roellig, T. L., Low, F. J., et al. 2004, ApJS, 154, 1 [NASA ADS] [CrossRef] [Google Scholar]
- Wright, E. L., Eisenhardt, P. R. M., Mainzer, A. K., et al. 2010, AJ, 140, 1868 [Google Scholar]
- Yajima, Y., Sorai, K., Miyamoto, Y., et al. 2021, PASJ, 73, 257 [NASA ADS] [CrossRef] [Google Scholar]
- Ysard, N., Köhler, M., Jones, A., et al. 2015, A&A, 577, A110 [NASA ADS] [CrossRef] [EDP Sciences] [Google Scholar]
- Ysard, N., Jones, A. P., Guillet, V., et al. 2024, A&A, 684, A34 [NASA ADS] [CrossRef] [EDP Sciences] [Google Scholar]
Appendix A: Images of Radial Profiles
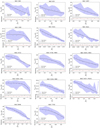 |
Fig. A.1. Tdust radial profiles as a function of the galaxy radius normalised by R25 for our sample except for IC 342, NGC 628, NGC 2403, and NGC 3031, already displayed in Fig. 3. |
Appendix B: Images of Method 2
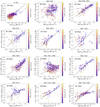 |
Fig. B.1. Pixel-by-pixel relation between Tdust and logΣdust according to Eq. (7) for our sample, except for NGC 3621 and NGC 5055, already displayed in Fig. 1. |
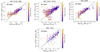 |
Fig. B.1. continued. |
All Tables
Dust heating mechanisms derived from both methods for each sample galaxy. “YS” = young stars; “ES” = evolved stars. AGN hosts are indicated by an asterisk (*).
All Figures
|
Fig. 1. Σdust (left) and Tdust (right) maps of the sample galaxy NGC 3031 (M 81) derived according to the prescriptions described in Sect. 2.1. The maps are shown at the SPIRE-500 resolution (36″), corresponding to 0.6 kpc at the galaxy’s distance. Only regions with S/N > 5 are shown. |
| In the text | |
|
Fig. 2. Same as Fig. 1 for ΣM* (left) and ΣSFR maps (right) of the sample galaxy NGC 3031 (M 81) derived according to the prescriptions described in Sect. 2.2. Only regions with S/N > 2 are shown. |
| In the text | |
|
Fig. 3. Tdust radial profiles as a function of the galaxy radius normalised by R25 for some sample galaxies (IC 342, NGC 628, NGC 3031, NGC 2403). Median Tdust values are shown as blue points, with the shaded blue regions indicating the total uncertainties, computed as the quadrature sum of the 16th and 84th percentiles and the modelling uncertainties (see Sect. 3.1). The dashed black line represents the Sérsic profile fit (see Eq. 3 and Table 2). The sampled physical scale for each galaxy is quoted in its respective panel. The lower panels display the residuals relative to the Sérsic fit. |
| In the text | |
|
Fig. 4. Panel a shows the median Tdust radial profile for all galaxies in our sample (blue). Panels b and c display the median Tdust profiles for barred (SAB-SB, purple) and unbarred (orange) galaxies, respectively. The panels d and e show the median Tdust profiles for AGN galaxies (red) and non-AGN (green) galaxies, respectively. The Tdust radial profiles are plotted as a function of the galaxy radius normalised by R25. The dashed line represents the fitted Sérsic profile (see Eq. 3), with the corresponding parameters listed in Table 3. |
| In the text | |
|
Fig. 5. Examples of the pixel-by-pixel Tdust − ΣSFR (left panels) and Tdust − ΣM* (right panels) correlations for two sample galaxies (NGC 2403 and NGC 5055). The colour bar represents the galaxy radius. The weighted Pearson correlation coefficient r (top-left corner) and the sampled physical scale (bottom-right corner) are quoted in the panels. |
| In the text | |
|
Fig. 6. Pixel-by-pixel relation between log Tdust and logΣdust according to Eq. (7) for two sample galaxies (NGC 3621 and NGC 5055). Blue points represent the mean values within each bin, with error bars indicating the standard deviation in each bin. The black line corresponds to the expected relation (see Eq. 7). The colour bar represents the galaxy radius. The sampled physical scale for each galaxy is quoted in its respective panel. |
| In the text | |
|
Fig. 7. Pearson correlation coefficient r of the Tdust − ΣSFR relation vs that of the Tdust − ΣM* relation. AGN galaxies are marked with stars, non-AGN galaxies with circles. The galaxies are colour-coded according to the p-values of the χ2 test (see Sect. 3.3.2): blue symbols to p < 0.05 (aligned with the young star-driven heating assumption: YS) and orange symbols correspond to p ≥ 0.05 (deviation from the young star heating assumption: not YS). The black dashed line represents the 1:1 relation. The grey histograms in the margins show the distributions of the correlation coefficients for Tdust − ΣSFR (top) and Tdust − ΣM* (right). |
| In the text | |
|
Fig. A.1. Tdust radial profiles as a function of the galaxy radius normalised by R25 for our sample except for IC 342, NGC 628, NGC 2403, and NGC 3031, already displayed in Fig. 3. |
| In the text | |
|
Fig. B.1. Pixel-by-pixel relation between Tdust and logΣdust according to Eq. (7) for our sample, except for NGC 3621 and NGC 5055, already displayed in Fig. 1. |
| In the text | |
|
Fig. B.1. continued. |
| In the text | |
Current usage metrics show cumulative count of Article Views (full-text article views including HTML views, PDF and ePub downloads, according to the available data) and Abstracts Views on Vision4Press platform.
Data correspond to usage on the plateform after 2015. The current usage metrics is available 48-96 hours after online publication and is updated daily on week days.
Initial download of the metrics may take a while.