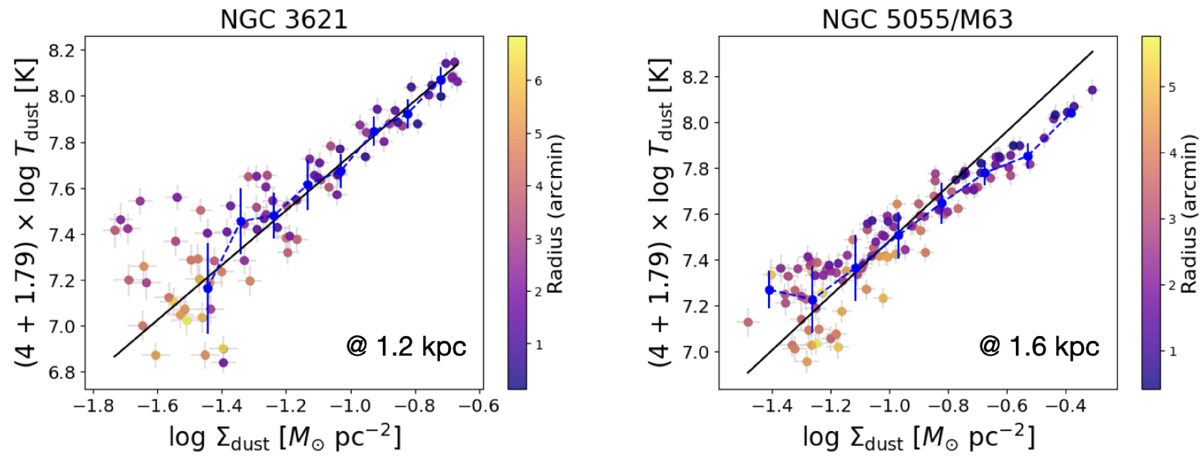
Fig. 6.
Download original image
Pixel-by-pixel relation between log Tdust and logΣdust according to Eq. (7) for two sample galaxies (NGC 3621 and NGC 5055). Blue points represent the mean values within each bin, with error bars indicating the standard deviation in each bin. The black line corresponds to the expected relation (see Eq. 7). The colour bar represents the galaxy radius. The sampled physical scale for each galaxy is quoted in its respective panel.
Current usage metrics show cumulative count of Article Views (full-text article views including HTML views, PDF and ePub downloads, according to the available data) and Abstracts Views on Vision4Press platform.
Data correspond to usage on the plateform after 2015. The current usage metrics is available 48-96 hours after online publication and is updated daily on week days.
Initial download of the metrics may take a while.