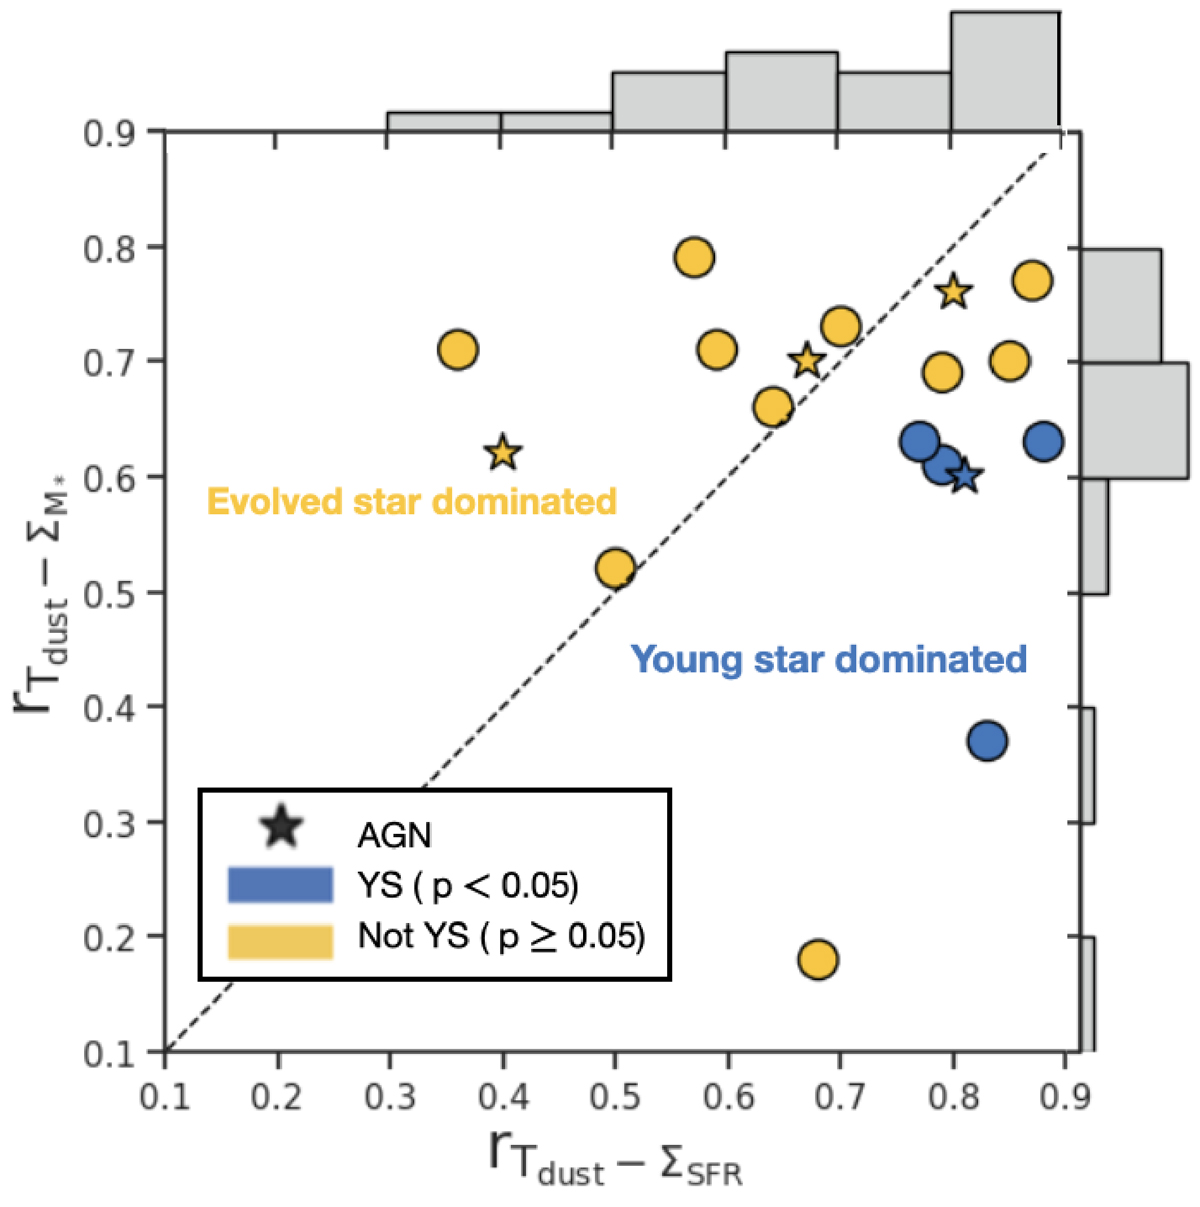
Fig. 7.
Download original image
Pearson correlation coefficient r of the Tdust − ΣSFR relation vs that of the Tdust − ΣM* relation. AGN galaxies are marked with stars, non-AGN galaxies with circles. The galaxies are colour-coded according to the p-values of the χ2 test (see Sect. 3.3.2): blue symbols to p < 0.05 (aligned with the young star-driven heating assumption: YS) and orange symbols correspond to p ≥ 0.05 (deviation from the young star heating assumption: not YS). The black dashed line represents the 1:1 relation. The grey histograms in the margins show the distributions of the correlation coefficients for Tdust − ΣSFR (top) and Tdust − ΣM* (right).
Current usage metrics show cumulative count of Article Views (full-text article views including HTML views, PDF and ePub downloads, according to the available data) and Abstracts Views on Vision4Press platform.
Data correspond to usage on the plateform after 2015. The current usage metrics is available 48-96 hours after online publication and is updated daily on week days.
Initial download of the metrics may take a while.