Fig. 1
Download original image
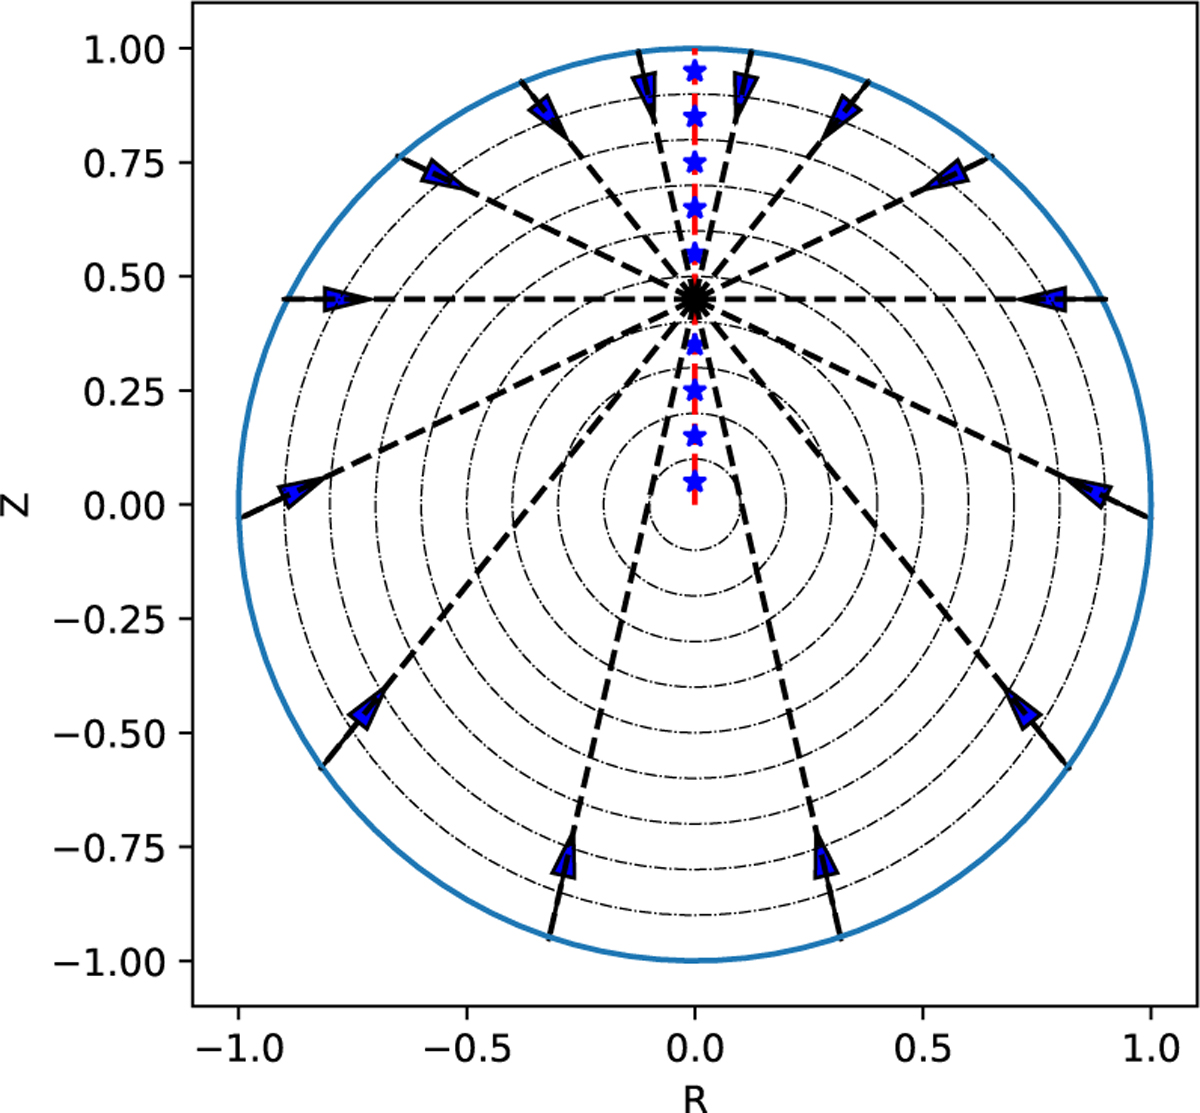
Schematic diagram of the radiative transfer of hydrogen RRLs and continuum emission in the new model. The large blue circle shows the boundary of the spherical H II region. The blue asterisks represent the grid points for which the mean incident radiation field needs to be calculated. The dashed black lines show the radiation transfer paths in different directions. The arrows indicate the direction of propagation of the RRLs and the continuum emission. R and Z are the normalized radial and axial coordinates in the axisymmetric coordinate system.
Current usage metrics show cumulative count of Article Views (full-text article views including HTML views, PDF and ePub downloads, according to the available data) and Abstracts Views on Vision4Press platform.
Data correspond to usage on the plateform after 2015. The current usage metrics is available 48-96 hours after online publication and is updated daily on week days.
Initial download of the metrics may take a while.