Fig. A.6
Download original image
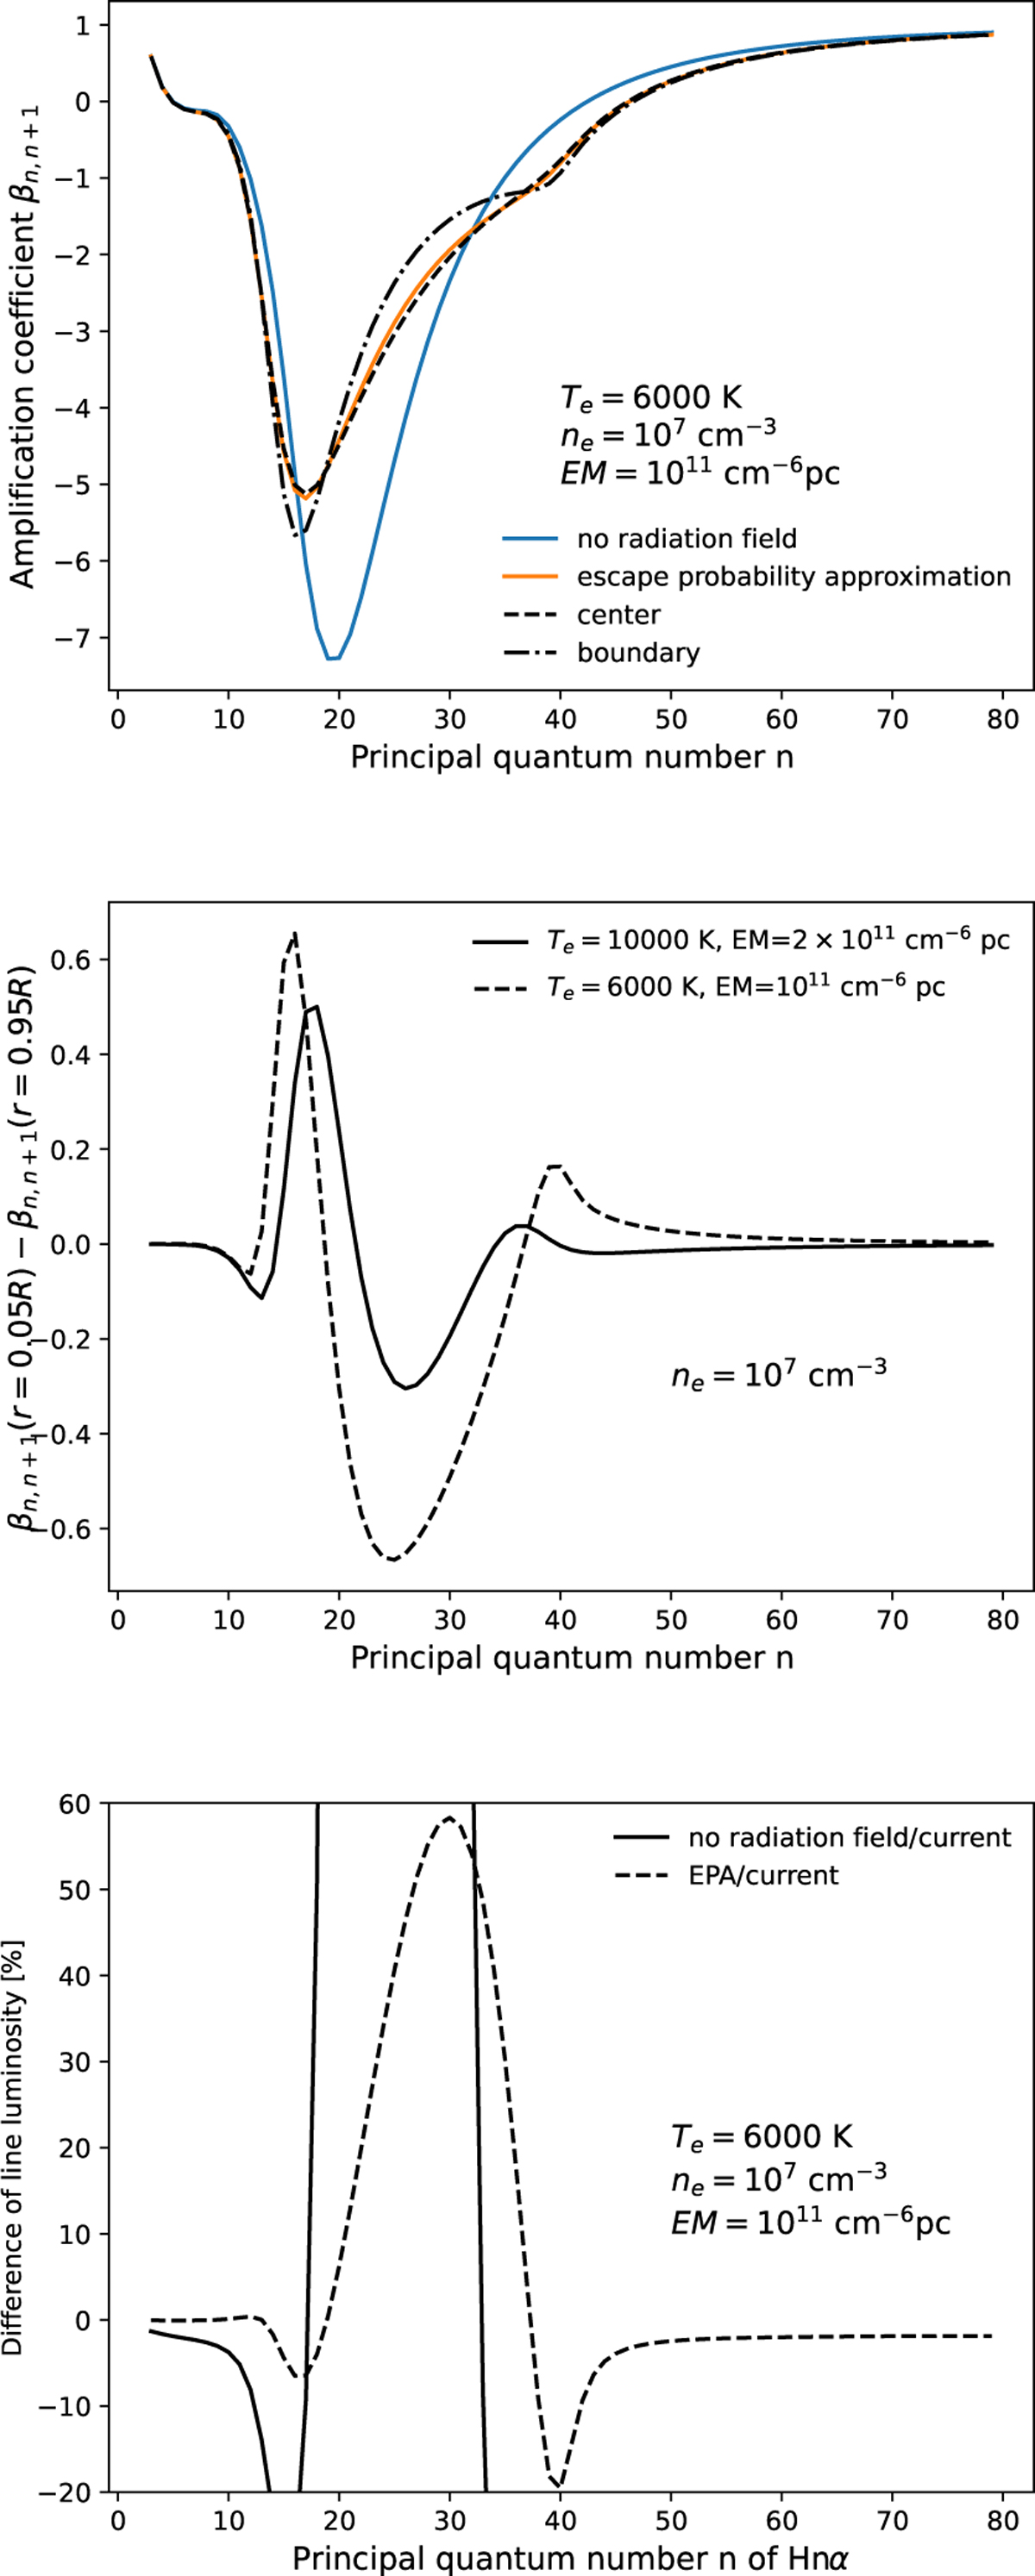
The comparison of the calculated amplification coefficients βn,n+1 using the Case B model, the EPA model, and the current model with full radiative transfer is plotted in the top panel. The electron temperature and density of the H II region are 6000 K and 107 cm–3. The value of EM is 1011 cm–6 pc. The differences between βn,n+1 in the center and the boundary of H II regions in two cases of identical ne but different Te and EM are plotted in the middle panel. In the bottom panel, the differences between the luminosities of Hnα lines calculated using the Case B model, the EPA model and the current model for the case of Te = 6000 K, ne = 107 cm–3, and EM= 1011 cm–6 pc are presented.
Current usage metrics show cumulative count of Article Views (full-text article views including HTML views, PDF and ePub downloads, according to the available data) and Abstracts Views on Vision4Press platform.
Data correspond to usage on the plateform after 2015. The current usage metrics is available 48-96 hours after online publication and is updated daily on week days.
Initial download of the metrics may take a while.