Fig. A.7
Download original image
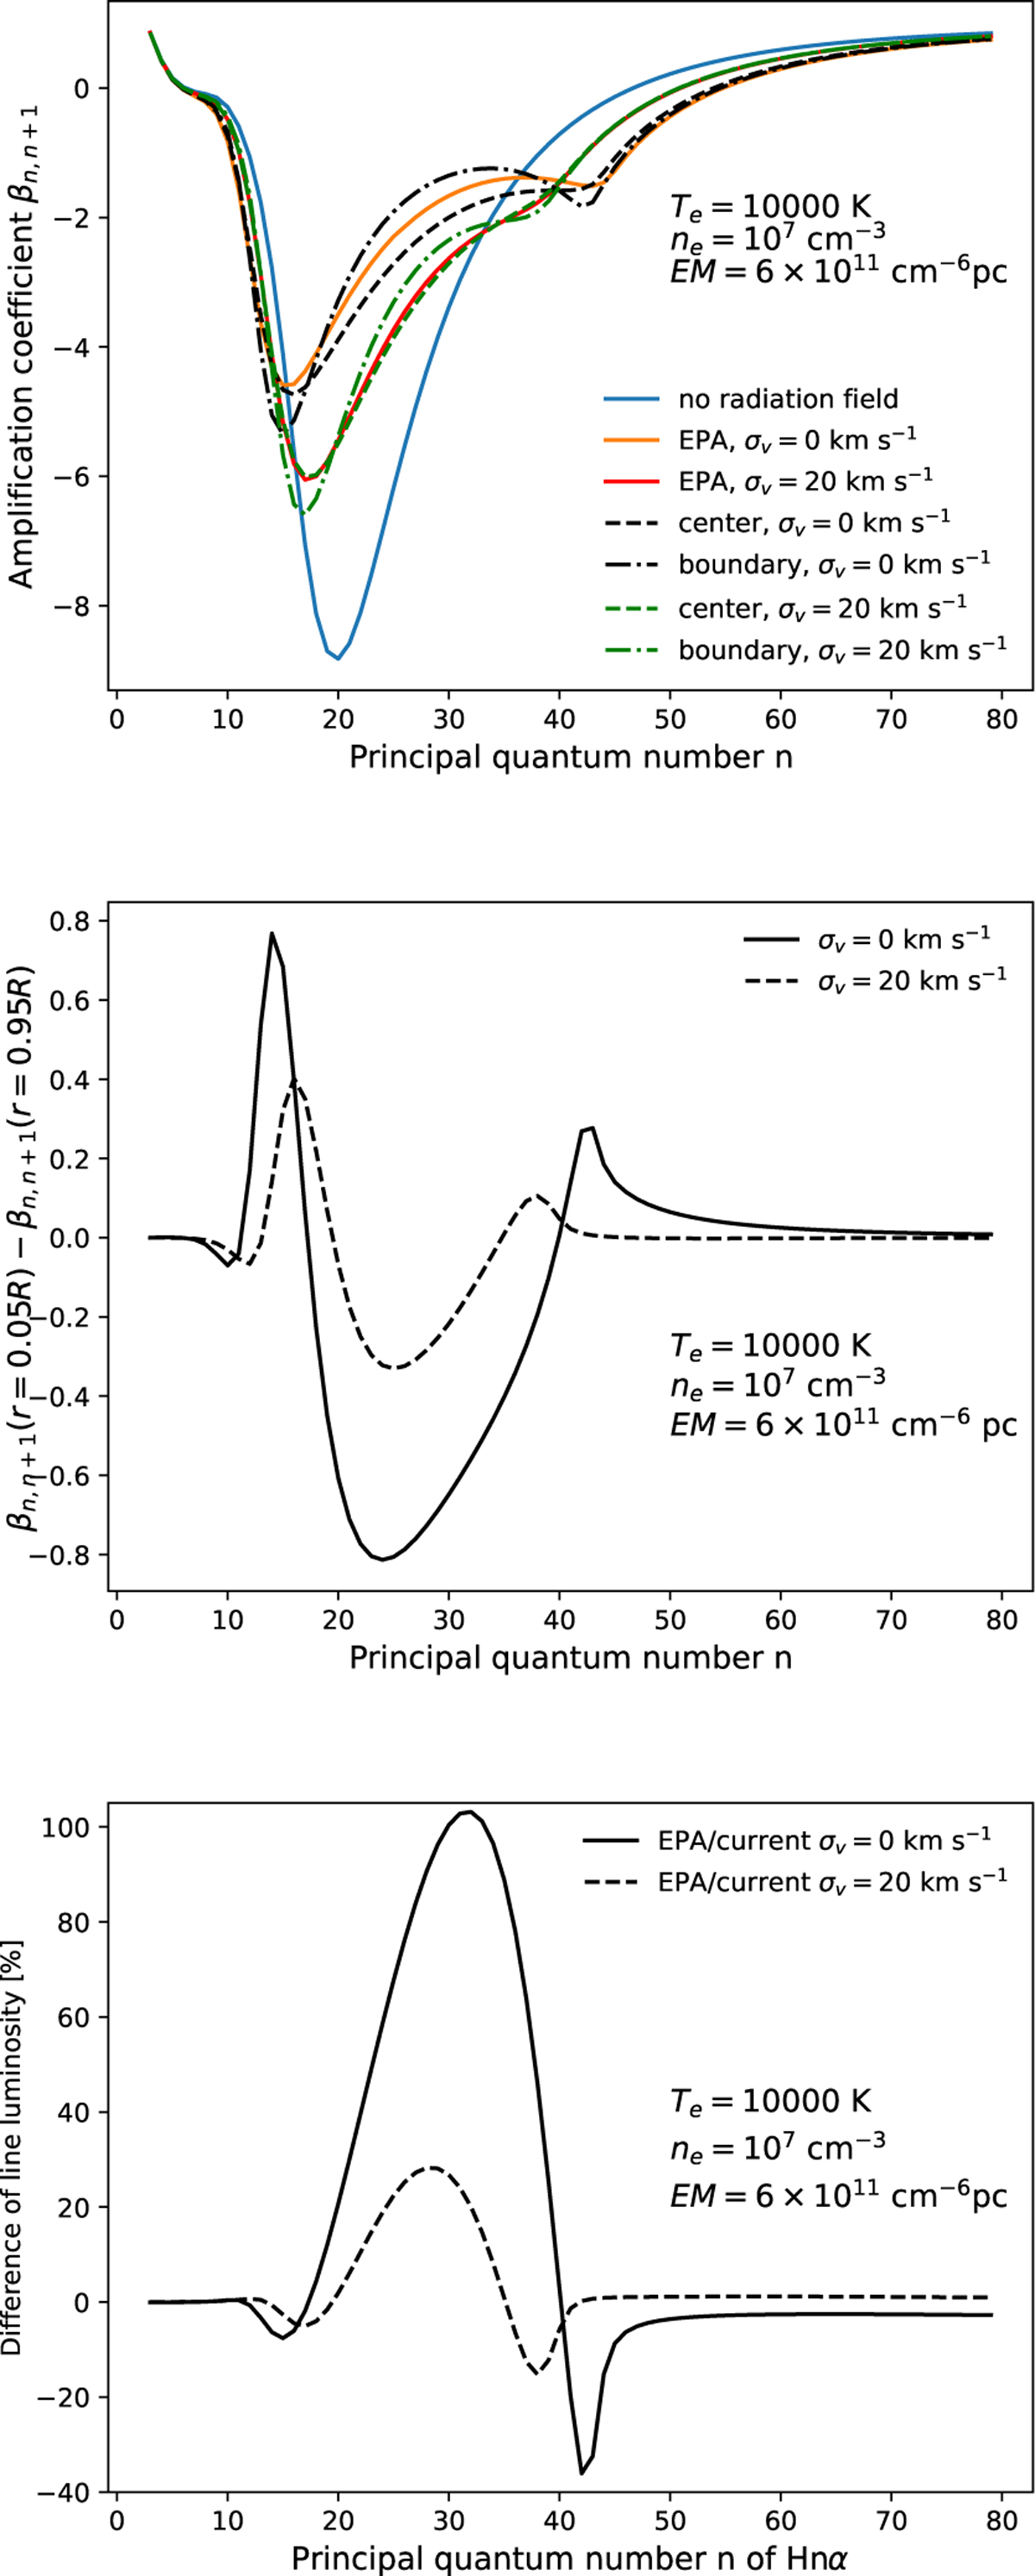
The comparison of the calculated amplification coefficients βn,n+1 using the EPA model and the current model with full radiative transfer is plotted in the top panel. The corresponding comparisons of the βn,n+1 in the center and boundary of H II regions, and the line luminosities are shown in the middle and bottom panels, respectively. The electron temperature, density and EM are 10000 K, 107 cm–3, and 6 × 1011 cm–6 pc, respectively. The συ is 0 km s–1 and 20 km s–1 in the two cases.
Current usage metrics show cumulative count of Article Views (full-text article views including HTML views, PDF and ePub downloads, according to the available data) and Abstracts Views on Vision4Press platform.
Data correspond to usage on the plateform after 2015. The current usage metrics is available 48-96 hours after online publication and is updated daily on week days.
Initial download of the metrics may take a while.