Fig. 3
Download original image
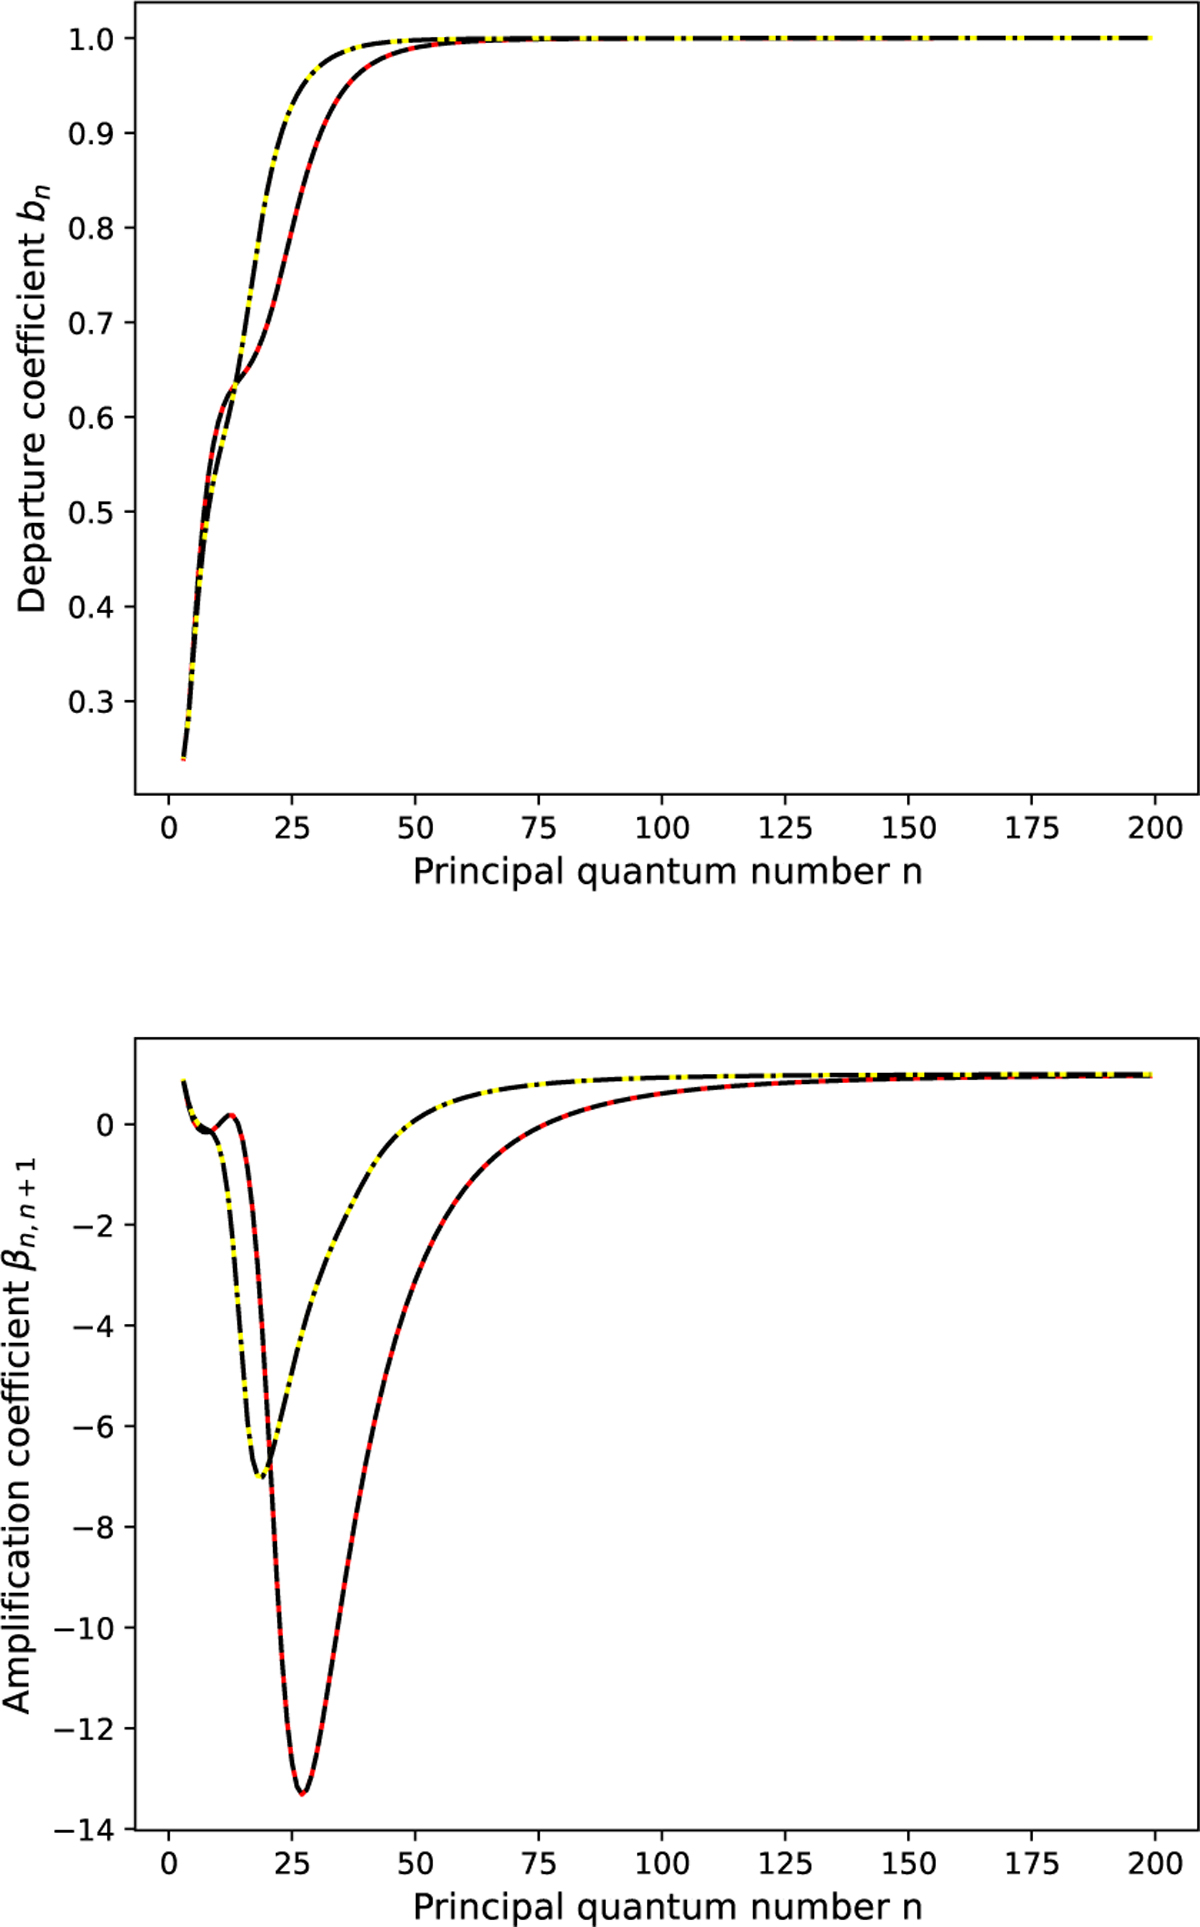
Comparison of the results calculated from the improved new model with or without the second simplification described in Section 2.5. The solid red and yellow lines show the results calculated without the simplification for Te = 10 000 K, ne = 106 cm–3, and EM=1010 cm–6 pc and Te = 10 000 K, ne = 107 cm–3, and EM=1011 cm–6 pc, respectively. The dashed and dash-dotted black lines are those calculated with the simplification for the corresponding cases. In the top panel, we plot bn at the center of uniform spherical H II regions. βn,n+1 is presented in the bottom panel.
Current usage metrics show cumulative count of Article Views (full-text article views including HTML views, PDF and ePub downloads, according to the available data) and Abstracts Views on Vision4Press platform.
Data correspond to usage on the plateform after 2015. The current usage metrics is available 48-96 hours after online publication and is updated daily on week days.
Initial download of the metrics may take a while.