Open Access
Fig. 4
Download original image
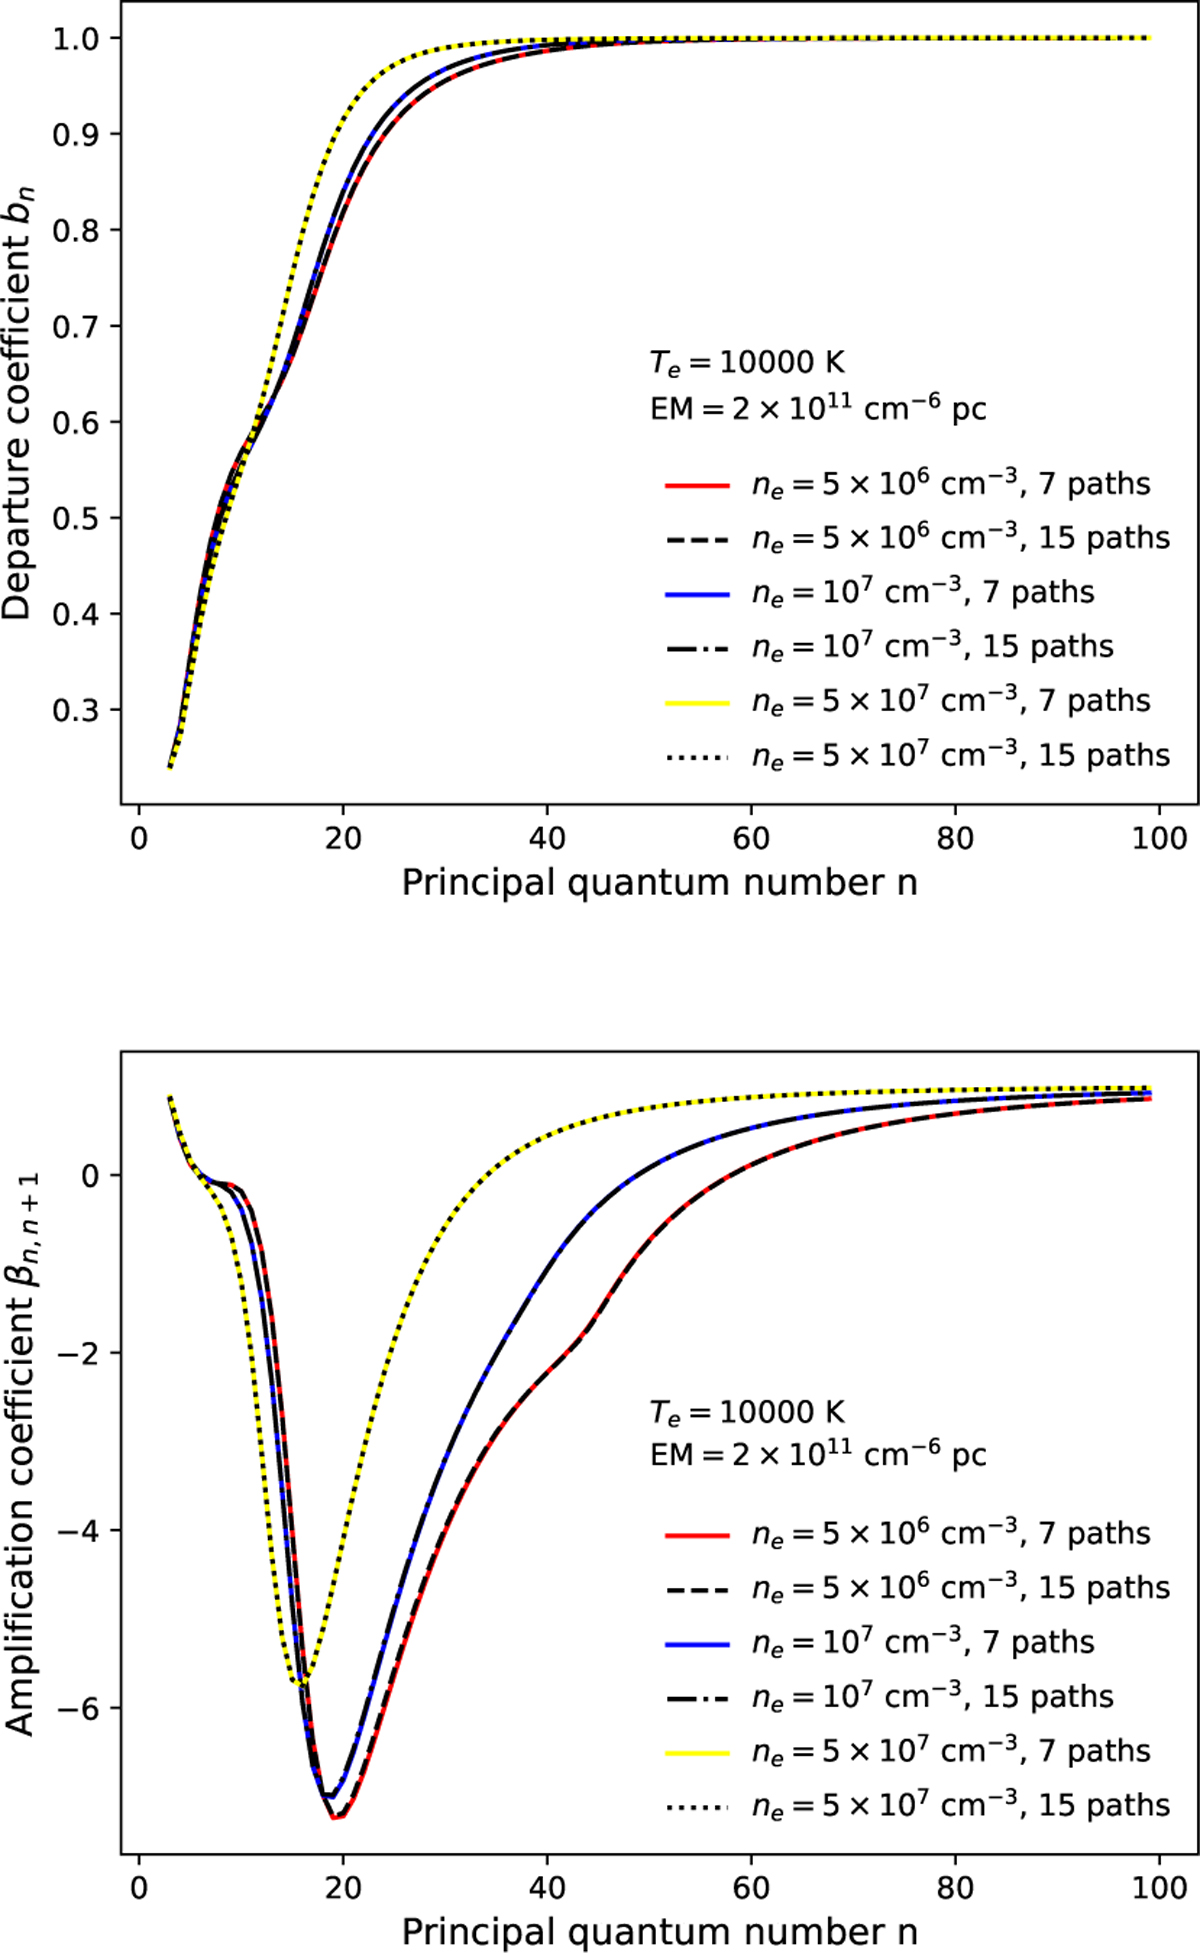
Comparison of the results calculated with the improved new model in which radiative transfer is treated along 7 and 15 paths for some exemplary cases. In the top panel, we plot bn at the center of uniform spherical H II regions. The correspondingis βn,n+1 is presented in the bottom panel.
Current usage metrics show cumulative count of Article Views (full-text article views including HTML views, PDF and ePub downloads, according to the available data) and Abstracts Views on Vision4Press platform.
Data correspond to usage on the plateform after 2015. The current usage metrics is available 48-96 hours after online publication and is updated daily on week days.
Initial download of the metrics may take a while.