Fig. 1.
Download original image
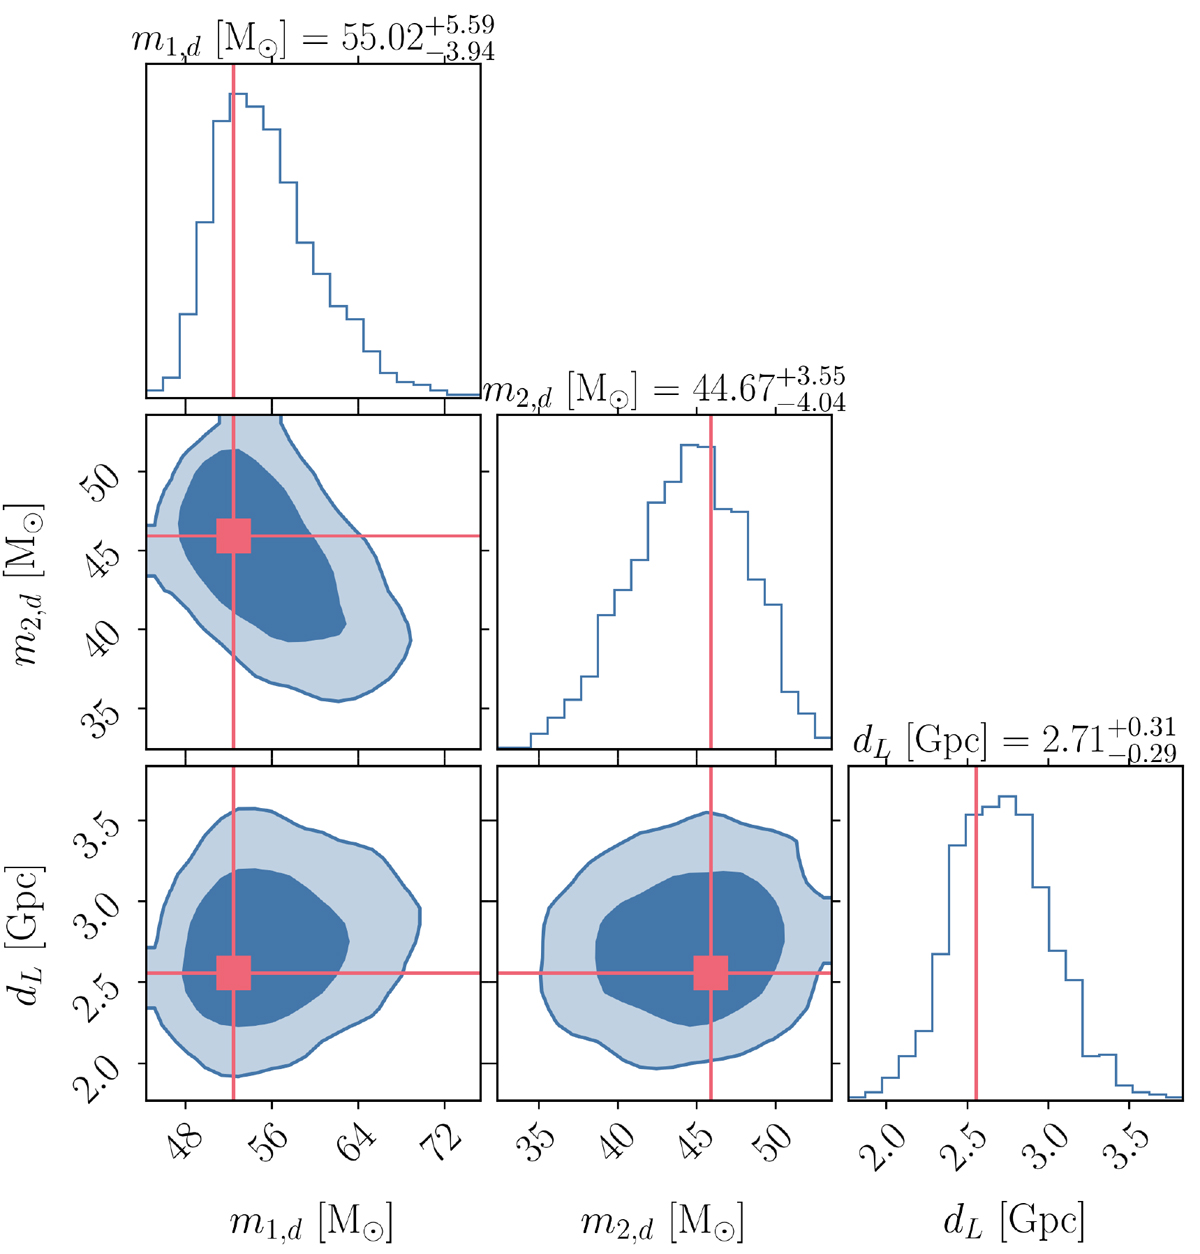
Corner plot showing the posterior distributions of the key parameters estimated from the simulation (blue). The red lines represent the true values of the parameters injected into the simulation. The diagonal panels display the marginalized 1D posterior distributions for each parameter, while the off-diagonal panels show the 2D joint posterior distributions.
Current usage metrics show cumulative count of Article Views (full-text article views including HTML views, PDF and ePub downloads, according to the available data) and Abstracts Views on Vision4Press platform.
Data correspond to usage on the plateform after 2015. The current usage metrics is available 48-96 hours after online publication and is updated daily on week days.
Initial download of the metrics may take a while.