Fig. 2.
Download original image
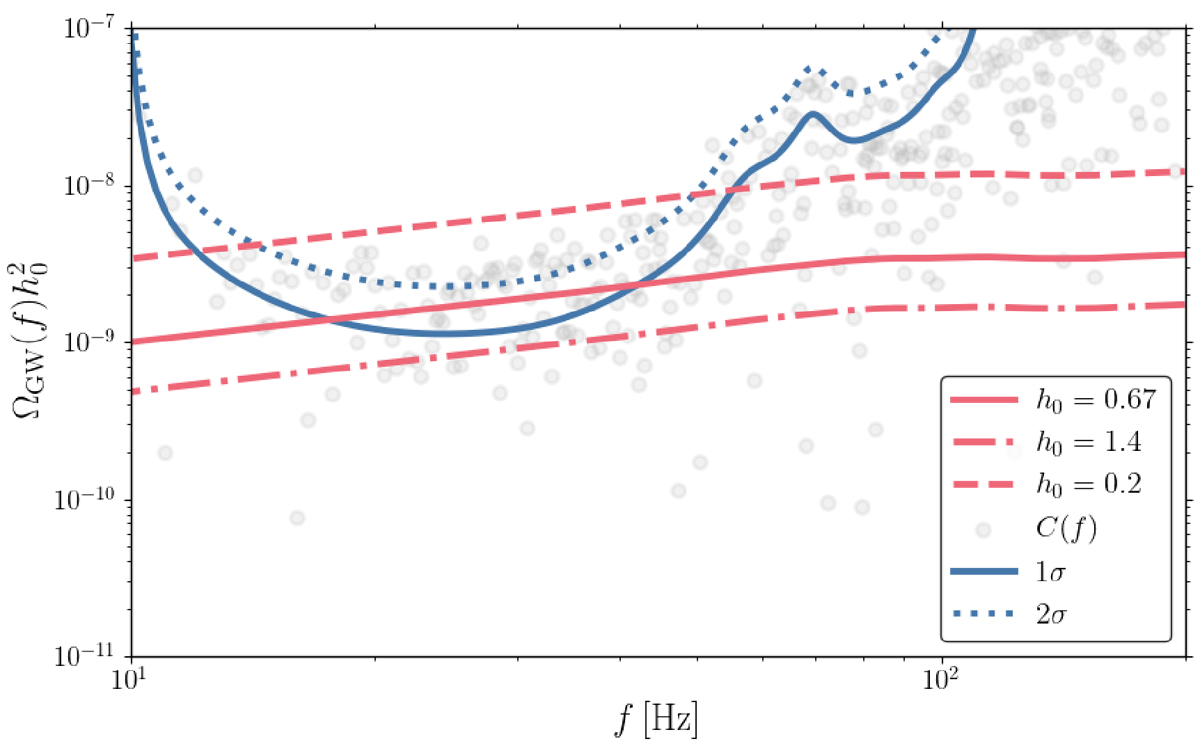
Simulated SGWB cross-correlation spectrum, C(f) (points) with corresponding uncertainties, σ(f) (gray lines). The red lines are theoretical curves of ΩGW(f) for different h02, and the blue curves display the 1σ and 2σ sensitivity of the LVK at the design sensitivity (1 year of observation in O5). The scatter reflects realistic fluctuations centered on the true ΩGW(f).
Current usage metrics show cumulative count of Article Views (full-text article views including HTML views, PDF and ePub downloads, according to the available data) and Abstracts Views on Vision4Press platform.
Data correspond to usage on the plateform after 2015. The current usage metrics is available 48-96 hours after online publication and is updated daily on week days.
Initial download of the metrics may take a while.