Fig. 7.
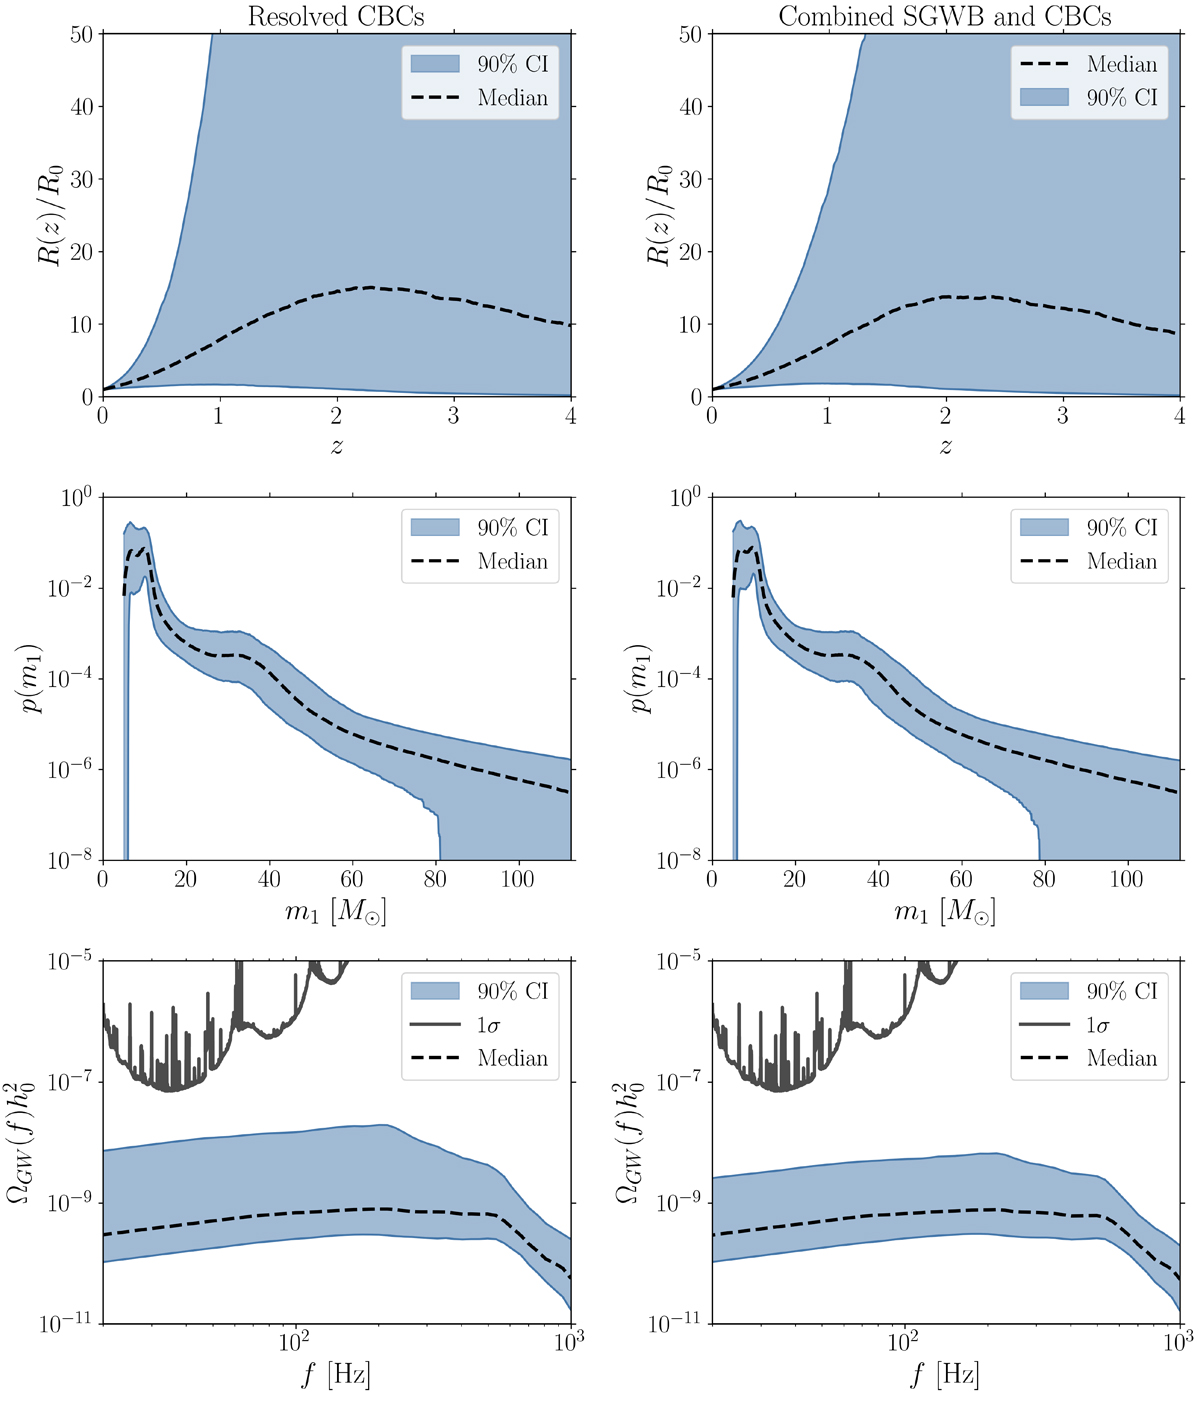
Download original image
PPCs for the resolved CBC analysis (left) and the joint analysis of the two sources (right). The dashed black and solid blue curves show the median and 90% credible bounds, and the red curve is the fiducial value injected. Top panel: Rate density, R(z), of BBH mergers over the local merger rate, R0, as a function of redshift. Middle panel: Primary mass distribution as a function of the primary mass. Bottom panel: Posterior on ΩGWh02 as a function of the frequency. In all the panels, the black line represents the 1σ curve.
Current usage metrics show cumulative count of Article Views (full-text article views including HTML views, PDF and ePub downloads, according to the available data) and Abstracts Views on Vision4Press platform.
Data correspond to usage on the plateform after 2015. The current usage metrics is available 48-96 hours after online publication and is updated daily on week days.
Initial download of the metrics may take a while.