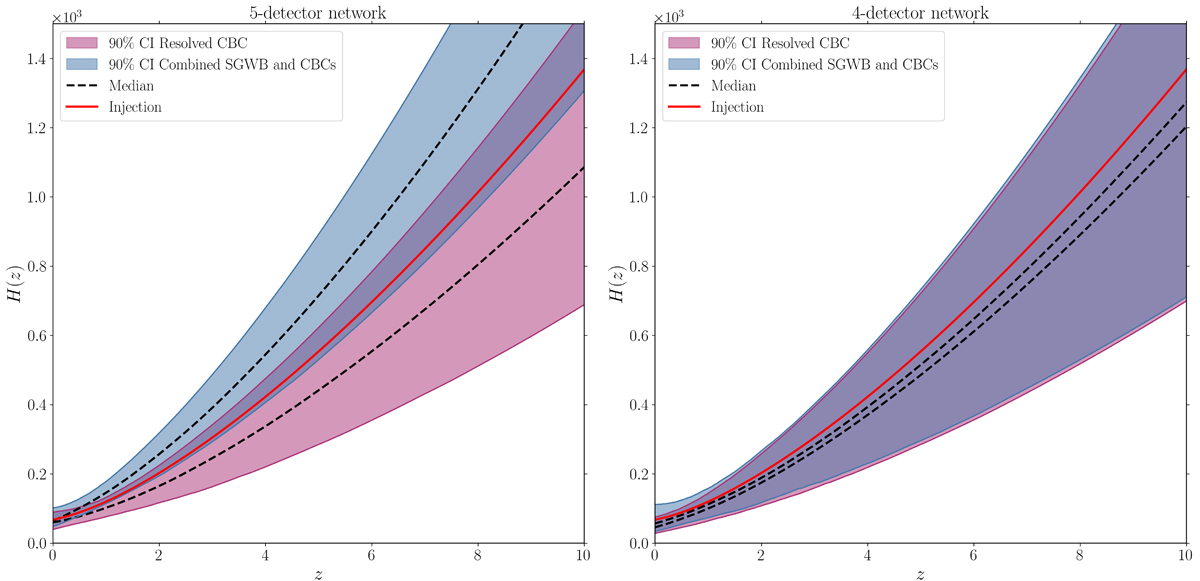
Fig. B.1.
Download original image
Posterior predictive distributions for the resolved CBCs dataset (purple) and the combined SGWB and CBCs dataset (blue) for results based on five (right) and four detectors (left). The solid black lines indicate the median predictions, with dashed lines showing the 90% CIs. The red curve denotes the injected (fiducial) model.
Current usage metrics show cumulative count of Article Views (full-text article views including HTML views, PDF and ePub downloads, according to the available data) and Abstracts Views on Vision4Press platform.
Data correspond to usage on the plateform after 2015. The current usage metrics is available 48-96 hours after online publication and is updated daily on week days.
Initial download of the metrics may take a while.