Fig. 1
Download original image
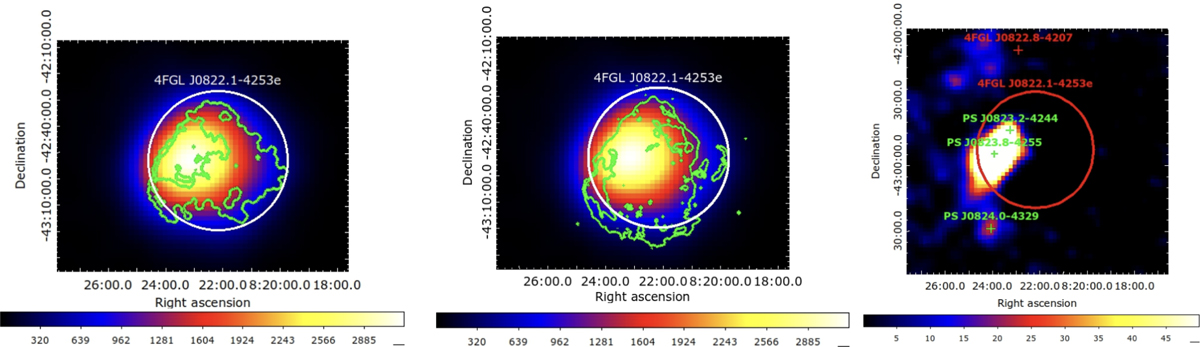
Left panel: Fermi-LAT TS map showing the γ-ray emission of Puppis A. The white circle marks the uniform disk used to fit Puppis A in 4FGL-DR3. The green contours mark the contour levels at 1% and 10% of the maximum of the eROSITA map (Mayer et al. 2022). Central panel: same as left panel but with radio VLA contours at 7% and 15% of the maximum of the VLA map. Right panel: residual TS map obtained by fitting the ROI (see text) using the disk template shown in the top panel. The red circle shows the uniform disk that models Puppis A (same as the white circle in the top panel), the red cross indicates the source 4FGL-J0822.8-4207 and the green crosses indicate the new sources needed to fit the gamma-ray excesses (Table 1).
Current usage metrics show cumulative count of Article Views (full-text article views including HTML views, PDF and ePub downloads, according to the available data) and Abstracts Views on Vision4Press platform.
Data correspond to usage on the plateform after 2015. The current usage metrics is available 48-96 hours after online publication and is updated daily on week days.
Initial download of the metrics may take a while.