| Issue |
A&A
Volume 701, September 2025
|
|
|---|---|---|
| Article Number | A206 | |
| Number of page(s) | 14 | |
| Section | Interstellar and circumstellar matter | |
| DOI | https://doi.org/10.1051/0004-6361/202555126 | |
| Published online | 16 September 2025 | |
Evidence for protons accelerated and escaped from the Puppis A region using Fermi-LAT observations
1
Dipartimento di Fisica e Chimica E. Segrè, Università degli Studi di Palermo,
Piazza del Parlamento 1,
90134
Palermo,
Italy
2
INAF – Osservatorio Astronomico di Palermo,
Piazza del Parlamento 1,
90134
Palermo,
Italy
3
AIM, CEA, CNRS, Université Paris-Saclay, Université de Paris,
91191
Gif sur Yvette,
France
4
Universitè Bordeaux, CNRS, LP2I Bordeaux,
UMR 5797,
33170
Gradignan,
France
5
Université de Paris, CNRS, Astroparticule et Cosmologie,
75013
Paris,
France
6
Department of Physics, Nagoya University, Furo-cho, Chikusa-ku,
Nagoya, Aichi
464-8601,
Japan
7
Faculty of Engineering, Gifu University,
1-1 Yanagido, Gifu,
Gifu
501-1193,
Japan
8
Dr. Karl Remeis-Sternwarte and Erlangen Centre for Astroparticle Physics, Friedrich-Alexander Universität Erlangen-Nürnberg,
Sternwartstraße 7,
96049
Bamberg,
Germany
9
Max-Planck-Institut für extraterrestrische Physik,
Giessenbachstrasse,
85748
Garching,
Germany
10
Max-Planck Institut für Radioastronomie,
Auf dem Hügel 69,
53121
Bonn,
Germany
★ Corresponding author.
Received:
11
April
2025
Accepted:
15
July
2025
Abstract
Supernova remnants (SNRs) interacting with molecular clouds are interesting laboratories for studying the acceleration of cosmic rays and their propagation in the dense ambient medium. We analyzed 14 years of Fermi-LAT observations of the supernova remnant Puppis A to investigate its asymmetric γ-ray morphology and spectral properties. This middle-aged remnant (~4 kyr) is evolving in an inhomogeneous environment, interacting with a dense molecular cloud in the northeast and a lower-density medium in the southwest. We find clear differences in both γ-ray luminosity and spectral energy distribution between these two regions. The emission from both sides is consistent with a hadronic origin. However, whereas the southwestern emission can be explained by standard diffusive shock acceleration (DSA), the northeastern side may involve reacceleration of preexisting cosmic rays or acceleration via reflected shocks in the dense cloud environment. Additionally, we identify two significant γ-ray excesses outside the remnant, including a previously unreported source to the south. These features are likely produced by cosmic rays that have escaped Puppis A and are interacting with nearby dense molecular material. From this extended emission, we estimate the total energy in escaping cosmic rays to be WCR ~ 1.5 × 1049 erg, providing important constraints on cosmic-ray propagation around the remnant.
Key words: acceleration of particles / shock waves / cosmic rays / ISM: supernova remnants
© The Authors 2025
 Open Access article, published by EDP Sciences, under the terms of the Creative Commons Attribution License (https://creativecommons.org/licenses/by/4.0), which permits unrestricted use, distribution, and reproduction in any medium, provided the original work is properly cited.
This article is published in open access under the Subscribe to Open model. This email address is being protected from spambots. You need JavaScript enabled to view it. to support open access publication.
1 Introduction
The γ–ray emission of supernova remnants (SNRs) provides direct evidence of particle acceleration at their shock fronts. Two different physical processes can be invoked for the production of γ–ray emission, namely the leptonic and hadronic scenarios. The leptonic case involves emission from ultrarelativistic electrons via inverse Compton (IC) and/or bremsstrahlung. In the hadronic scenario, proton acceleration can be studied via pion decay associated with the impacts of high-energy hadrons with the ambient medium: proton-proton interaction produces a neutral pion which subsequently decays into two gamma rays. This emission can be enhanced in SNRs evolving in a dense interstellar medium, where the accelerated particles interact with the dense gas. This makes SNRs interacting with molecular clouds (MCs) interesting laboratories for studying hadron acceleration. Another mechanism that may be responsible for γ–ray emission from SNRs interacting with dense MCs involves the reacceleration process. In particular, Uchiyama et al. (2010) showed that the γ-ray emission from middle-aged SNRs can be explained by the crushed cloud scenario, in which the emission arises from radiatively compressed, shocked clouds. Bright synchrotron radio emission is also expected to stem from this “crushed cloud” (Blandford & Cowie 1982). Examples include W51C, W44, and IC 443 (Uchiyama et al. 2010). In particular, the multiwavelength spectrum of W44 can be well explained by reaccelerated particles alone, without requiring any spectral break, only a high-energy cutoff corresponding to the maximum energy achievable by the accelerator (Cardillo et al. 2016). Moreover, particles escaping from the SNR shock may be responsible for γ-ray emission in nearby interstellar clouds, thus providing indirect evidence of cosmic-ray acceleration and escape from the SNR (Aharonian & Atoyan 1996; Gabici & Aharonian 2007; Gabici et al. 2009; Ohira et al. 2011; Mitchell et al. 2021).
Puppis A is a 4 kyr old (Winkler et al. 1988; Becker et al. 2012; Mayer et al. 2020), shell-like Galactic SNR at a distance of approximately 1.3 kpc (Reynoso et al. 2017), with an angular diameter of approximately 50′ (around 11 pc). It has been observed across different energy bands, including radio, X-rays, and γ-rays. The radio emission of Puppis A was analyzed using VLA observations (Dubner et al. 1991; Castelletti et al. 2006) and is characterized by very bright synchrotron radiation in the eastern side of the remnant (see green contours in the central panel of Fig. 1). The eastern region is also characterized by high surface brightness in X-rays and includes the Bright Eastern Knot (BEK), which is indicative of shock-cloud interaction (Hwang et al. 2005). The asymmetry in the X-ray emission was confirmed by Dubner et al. (2013) and Mayer et al. (2022), revealing that the remnant is evolving in an inhomogeneous ambient medium. The X-ray emission of Puppis A is mainly dominated by thermal emission from shock-heated interstellar medium (Hwang et al. 2005), although isolated ejecta knots have also been detected (Hwang et al. 2008; Katsuda et al. 2008, 2010; Mayer et al. 2022).
Owing to its interaction with interstellar clouds (see Dubner & Arnal 1988; Aruga et al. 2022), Puppis A is an interesting source for studying particle acceleration. In particular, interaction with this complex ambient medium can result in various parts of the remnant being in different evolutionary phases (as observed in the Cygnus Loop; Tutone et al. 2021). Previous studies have investigated the γ-ray emission of Puppis A with the Fermi-LAT telescope, with Hewitt et al. (2012) using four years of observations and Xin et al. (2017) using 7 years. These studies identified an asymmetry in the morphology of the source (the eastern side being brighter than the western side) that is consistent with the X-ray morphology. The γ-ray spectrum analyzed in Hewitt et al. (2012) can be fit with a power law with an index Γ = 2.1 in the 200 MeV–0.1 TeV energy range. They also found indications of slightly softer emission in the western part of the remnant, although limited statistics prevented confirmation. Hewitt et al. (2012) estimated the total energy of the accelerated particles to be E ~ 5 × 1049 erg, while Xin et al. (2017) report E ~ 7.5 × 1049 (n/4.0 cm−3)−1 erg. In both previous studies, a leptonic scenario for the γ-ray emission of Puppis A was disfavored for the following reasons. An inverse Compton (IC)-dominated model requires both an unusually low ambient density and a significantly high electron-to-proton ratio. Similarly, a bremsstrahlung-dominated emission also requires an exceptionally high electron-to-proton ratio. Moreover, the spectral break observed at radio frequencies across the entire remnant implies a corresponding break in the electron spectrum, which is not reflected at γ-ray energies. Consequently, the authors concluded that the hadronic scenario is the most plausible explanation.
To investigate the origin of the γ-ray emission, H.E.S.S. Collaboration (2015) explored the emission of Puppis A at very high energies (VHE), but did not obtain a significant detection. The non-detection of Puppis A by H.E.S.S. can be interpreted as a signature of a shock velocity that is not large enough to accelerate particles up to TeV energies.
Araya et al. (2022) also studied the γ-ray emission of Puppis A using 14 years of Fermi-LAT observations. They aimed to investigate the origin of the point-like γ-ray source 4FGL J0822.8-4207, suggesting that it may be associated with cosmic rays accelerated by and escaped from Puppis A interacting with a denser ambient medium, or with the protostellar jet HH 219.
In this paper, we report on the analysis of 14 years of Fermi-LAT observations, which significantly improve the statistics compared to the data analyzed by Hewitt et al. (2012); Xin et al. (2017). The paper is organized as follows. Sect. 2 describes the Fermi-LAT observations and the data analysis; results on both the morphology of the source and the spectral analysis are shown in Sect. 3; discussions are presented in Sect. 4; and the conclusions are presented in Sect. 5.
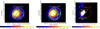 |
Fig. 1 Left panel: Fermi-LAT TS map showing the γ-ray emission of Puppis A. The white circle marks the uniform disk used to fit Puppis A in 4FGL-DR3. The green contours mark the contour levels at 1% and 10% of the maximum of the eROSITA map (Mayer et al. 2022). Central panel: same as left panel but with radio VLA contours at 7% and 15% of the maximum of the VLA map. Right panel: residual TS map obtained by fitting the ROI (see text) using the disk template shown in the top panel. The red circle shows the uniform disk that models Puppis A (same as the white circle in the top panel), the red cross indicates the source 4FGL-J0822.8-4207 and the green crosses indicate the new sources needed to fit the gamma-ray excesses (Table 1). |
2 Observations and data analysis
We analyzed 14 years of Fermi-LAT observations, from August 2008 to September 2022, focusing on the region of interest (ROI) of 15° × 15°, centered on 4FGL J0822.1-4253e (Puppis A, RA = 8h24m6.96s, Dec = −42°59′49.2″). The data were spatially binned at 0.03° with ten energy bins,. All sources from the Fermi-LAT 14-year Source Catalog (4FGL-DR4, Abdollahi et al. 2022; Ballet et al. 2023) within a region of 25° × 25° were included. We analyzed PASS 8 data1 using fermitools2 version 2.2.0 software and the Python package fermipy3 (Wood et al. 2017) version 1.2, filtering the data with DATA_QUAL>0, LAT_CONFIG==1. The background was modeled taking into account the sources in the 4FGL-DR4 catalog, the Galactic diffuse emission (provided by the file gll_iem_v07) and the “Source” events of the P8R3 instrument response functions (IRFs). We analyzed data from 1 GeV to 1 TeV for the morphological analysis (Sect. 3.1) and from 300 MeV to 1 TeV for the spectral analysis (Sect. 3.3). Only PSF3 events were selected between 300 MeV and 1 GeV because they provide the best angular resolution to resolve the source, while all PSF event types were included above 1 GeV. To reduce contamination from Earth’s limb, we selected only events with zenith angles <90° between 300 MeV and 1 GeV, and <105° above 1 GeV.
Coordinates of additional point-like sources for the uniform disk model.
3 Results
3.1 Morphological analysis
In order to study the morphology of an extended source such as Puppis A, we take advantage of the significant improvement in Fermi- LAT angular resolution at high energies by analyzing data only in the 1–1000 GeV energy band. We performed the analysis following the maximum likelihood method described in Mattox et al. (1996), which also provides the significance of each source as the square root of the test statistic (TS). This is given by TS = ![Mathematical equation: $\[2 ~\log~ \frac{L}{L_{0}}\]$](/articles/aa/full_html/2025/09/aa55126-25/aa55126-25-eq1.png) , where the likelihood Lis obtained by fitting the source model plus the background components (including other sources) to the data, while the likelihood L0 is derived by fitting the background components only. We performed the analysis by freeing the spectral parameters of the galactic diffuse background, the isotropic background, and all sources located within 10° of the ROI center with TS > 100. We then adopted the tool find_sources to localize new point-like sources with a TS value greater than 16. The TS map of Puppis A is shown in the left panel of Fig. 1.
, where the likelihood Lis obtained by fitting the source model plus the background components (including other sources) to the data, while the likelihood L0 is derived by fitting the background components only. We performed the analysis by freeing the spectral parameters of the galactic diffuse background, the isotropic background, and all sources located within 10° of the ROI center with TS > 100. We then adopted the tool find_sources to localize new point-like sources with a TS value greater than 16. The TS map of Puppis A is shown in the left panel of Fig. 1.
The right panel of Fig. 1 shows the difference between the morphology of Puppis A and the uniform disk used in the previous 4FGL-DR3 catalog. A bright emission in the eastern part of the remnant becomes visible when using the model in the previous catalog, 4FGL-DR3 (Abdollahi et al. 2022), in which Puppis A is fitted as a uniform disk. This excess can be modeled by adding the ad hoc point-like sources found in Araya et al. (2022): PS J0823.2-4244 and PS J0823.8-4255. The presence of this excess in the eastern part of Puppis A (fainter than Puppis A, but still significant at the 5 σ confidence level) shows that the uniform disk model does not adequately describe the source morphology due to an asymmetry in the emission of Puppis A. In the new catalog, 4FGL-DR4, the morphology of Puppis A has been improved using X-ray emission above 1 keV detected with eROSITA (Mayer et al. 2022). Moreover, we found a γ–ray emission excess beyond the southern border of the remnant (visible in the right panel of Fig. 1), which can be well fit by a point-like source (PS J0824.0-4329) with a TS value of 22. The coordinates of these additional sources are summarized in Table 1.
To find the best spatial model reproducing the morphology of Puppis A, we compared several templates (listed in Table 2), following the method in Hewitt et al. (2012)4. We compared the templates using the Akaike information criterion (AIC, Akaike 1998) which enables the comparison of non-nested templates based on their AIC value, AIC = −2 log(L) + 2k, where k is the number of degree of freedom5 and L the likelihood. We considered a better fit to correspond to a higher ΔAIC value, where ΔAIC= AIC0 − AICi (AIC0 is the AIC obtained for the disk plus two point-like sources, taken as a reference, and AICi is the AIC of the tested template). We confirmed the asymmetric γ–ray emission of Puppis A by comparing the fit obtained with the uniform disk provided in the 4FGL-DR3 catalog, with and without the two additional point-like sources within the remnant (namely, PS J0823.2-4244 and PS J0823.8-4255). The likelihood was significantly improved by including the additional sources, further confirming that the uniform disk does not accurately describe the morphology of the remnant.
We obtained similar results using radio maps of Puppis A as templates for the γ–ray morphology. In particular, we considered the Plank maps at 33 GHz and 44 GHz, the SUMSS map at 843 MHz and the VLA map at 1.4 GHz. The VLA contours are shown as an example in the middle panel of Fig. 1. We find that none of these radio templates can adequately describe the morphology of the observed γ-ray emission of Puppis A (especially on its eastern side), as shown by the likelihood values reported in Table 2.
In contrast, the residual TS maps obtained with X-ray templates, i.e., the Puppis A maps produced from XMM-Newton (Luna et al. 2016) and eROSITA (Mayer et al. 2022) observations6, do not show excess in the eastern part of the remnant and result in a better AIC (Table 2). By comparing the likelihoods obtained with the different X-ray templates (see Table 2), it is clear that the soft X-ray templates in the 0.7–1 keV band (obtained with both XMM-Newton and eROSITA) provide a significant improvement with respect to those in the hard band (1–8 keV). Moreover, the soft X-ray band is a better diagnostic of the total density of the X-ray-emitting plasma, as the hard band may miss the densest and coolest regions. The γ-ray emission depends on the total density, making this improvement in the fit notably coherent. We caution that the values for the very soft X-ray band (0.2–0.7 keV) should be interpreted carefully due to the higher absorption effects in that band.
It should also be noted that the X-ray maps in the 0.7–1 keV band can be affected by inhomogeneities in interstellar absorption across the remnant7. Significant variations in the interstellar column density, NH, have been measured through spatially resolved X-ray spectral analysis (Dubner et al. 2013; Mayer et al. 2022), with the highest values observed in the southern part of the shell. To correct for this bias, we adopted the unabsorbed X-ray map of Puppis A as a template, following the approach described in Mayer et al. (2022). The unabsorbed map of Puppis A in the 0.7–1 keV band is shown in the left panel of Fig. 2. The corresponding TS map is shown in the right panel of Fig. 2, confirming that this template provides the best description of the γ–ray emission (see also Table 2).
The unabsorbed map in the 0.7–1 keV band can be considered a good proxy for the plasma emission measure, indicating denser material in the northeastern part of Puppis A and a more tenuous environment in the southwest. This is consistent with the distribution of the ambient density: dense molecular clouds in the northeast and more tenuous atomic clouds in the southwest (Aruga et al. 2022). Similar results can be obtained by examining the distribution of hydrogen in the region of Puppis A. Figure 4 shows the distributions of the interstellar medium (ISM) proton column density, Np(H2 + HI), in the velocity range 8–20 km s−1 (see Fig. 8 in Aruga et al. 2022).
We then divided the unabsorbed X-ray template into two parts to analyze the two sides separately. In particular, we adopted a different strategy from that of Hewitt et al. (2012), dividing the template using a diagonal line, as shown in the left panel of Fig. 2, taking care to exclude all bright areas from the faint western part. This method provides a more precise division between the very bright and dim X-ray emission (reflecting regions of high and low ambient density, respectively), which is not taken into account in the method of Hewitt et al. (2012). This division does not significantly improve the fit (as also found in Hewitt et al. 2012), but provides important information for the spectral analysis (see Section 3.3). In conclusion, by comparing all templates using the AIC, the best model to reproduce the morphology of Puppis A is the X-ray template based on the unabsorbed eROSITA emission in the 0.7–1.0 keV energy (Fig. 2).
Comparison of spatial models used to fit the morphology of Puppis A between 1 GeV and 1 TeV.
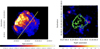 |
Fig. 2 Left panel: eROSITA unabsorbed flux image in erg/s/cm2/arcmin2 in the 0.7–1 keV band, with square-root scaling. The yellow line marks the separation between northeastern and southwestern side (see text). Right panel: residual TS map in which the morphology of Puppis A is fit with the template in the top panel and the source 4FGL J0822.8-4207 is considered as an extended source. |
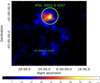 |
Fig. 3 Residual TS map showing the two γ-ray sources located outside Puppis A: 4FGL J0822.8-4207 to the north and PS J0824.0-4329 to the south. |
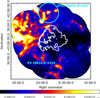 |
Fig. 4 Map of the distributions of the ISM proton column densities, Np(H2 + HI), in the velocity range of 8–20 km s−1 (see Fig. 8 in Aruga et al. 2022). White contours map the soft X-ray emission of Puppis A, and the two cyan regions mark the two γ-ray excesses found outside from the remnant. |
3.2 Detection of nearby sources
Using the eROSITA unabsorbed map in the 0.7–1 keV band as a template for the morphology of Puppis A, we then analyzed the source in the north of the remnant (4FGL J0822.8-4207, Araya et al. 2022) and that in the south (namely PS J0824.0-4329).
We confirm the detection of 4FGL J0822.8-4207, which was first reported in Ballet et al. (2020) and studied in detail in Araya et al. (2022), where it was classified as a point-like source. To describe the morphology of the source and assess its angular extension (if any), we adopted three templates: a point-like template, a radial Gaussian template, and a uniform disk template. For this analysis, we also allowed the center of the source to vary. We found TSext = 22.0, where TSext = 2 ln Lext/Lps and Lext and Lps are the likelihoods of the fits with the extended (Gaussian or uniform disk) and point-like source models, respectively. The values of TSext > 16 indicate a statistically significant detection of an extended source (Lande et al. 2012); therefore, we conclude that 4FGL J0822.8-4207 cannot be considered point-like. Very similar results are obtained with the uniform disk template (TSext = 18).
In conclusion, the source 4FGL J0822.8-4207 is significantly extended and its morphology can be modeled either as a radial Gaussian with sigma of 0.15 ± 0.03° or, equivalently, as a disk with radius 0.30 ± 0.05°. Figures 3 and 4 show the location of 4FGL J0822.8-4207 and its angular extension in the uniform disk scenario.
We performed the same morphological analysis on the new putative source detected in our study, namely PS J0824.0-4329 (see Sect 3.1 and Table 1). This source is located beyond the southern border of Puppis A (right panel of Figs. 1 and 4). In this case, TSext = 7.6 does not reach the minimum threshold of 16 for a source to be considered extended; consequently, PS J0824.0-4329 is consistent with being point-like. Figure 3 shows the two γ-ray sources overlaid with their spatial model. For visualization purposes, we used the uniform disk for 4FGL J0822.8-4207.
3.3 Spectral analysis
We present the spectral analysis for all the sources studied in this paper. Since the aim of the first part of the paper is to emphasize any differences between the two sides of the remnant, we conducted the spectral analysis in the 300 MeV–1 TeV energy band. As discussed in Sect. 3.1, we used the unabsorbed eROSITA image in the 0.7–1 keV band as the spatial template for the morphology of Puppis A (left panel of Fig. 2) and a radial Gaussian with sigma of 0.15 ± 0.03° for 4FGL J0822.8-4207. All additional point-like sources outside the remnant found in Section 3.1 were incorporated in the template, including PS J0824.0-4329.
The spectrum of Puppis A was fit using the Log Parabola spectral model available in gtlike:
![Mathematical equation: $\[\frac{d N}{d E}=N_0\left(\frac{E}{E_b}\right)^{-\left(\alpha+\beta \log \left(E / E_b\right)\right)},\]$](/articles/aa/full_html/2025/09/aa55126-25/aa55126-25-eq2.png) (1)
(1)
where N0 is the differential photon flux at Eb, α and β are the photon index at Eb and the half-curvature of the LogParabola, respectively, and Eb is a scale parameter fixed at 1 GeV.
Thanks to the improved statistics in the data analyzed here, we find that this model provides a significantly better description (Δ(TS) = 22) of the Fermi-LAT data points than a simple power law, which was adopted by Hewitt et al. (2012). The spectral energy distribution (SED) of Puppis A is shown in Fig. 5, where the blue crosses indicate the SED we obtained with the Fermi-LAT data (with statistical errors), while the green arrows mark the upper limits obtained with H.E.S.S. (H.E.S.S. Collaboration 2015).
To analyze the spectra of the northeastern and southwestern sides separately, we divided the template into two parts, as discussed in Section 3.1 and shown in Fig. 2. As expected, the entire Puppis A, its northeastern region, and its southwestern region are all significantly above the background, with TS values of 5429 for the entire remnant, 3555 for its northeastern side, and 390 for its southwestern side. The top and bottom panels of Fig. 6 show the SED that we obtained for the southwestern and northeastern regions of Puppis A, respectively. While the lower statistics of the data analyzed by Hewitt et al. (2012); Xin et al. (2017) previously hampered the possibility of detecting different spectral shapes between the two halves of the remnant, we find that the two spectra are indeed different. In particular, the available improved statistical precision allowed us to determine that the Log Parabola model fits the substantial curvature observed in the northeastern SED significantly better than a simple power law (Δ(TS) = 88). Conversely, we find that the spectral curvature is not significant up to the 3σ level for the southwestern side; therefore we fit the spectrum with a power law:
![Mathematical equation: $\[\frac{d N}{d E}=N_0\left(\frac{E}{E_0}\right)^{-\gamma}.\]$](/articles/aa/full_html/2025/09/aa55126-25/aa55126-25-eq3.png) (2)
(2)
Here, N0 is the differential photon flux at E0 (see Table 3), γ is the photon index, and E0 is the energy scale, fixed at 1 GeV. Our results for the southwestern side are consistent with the model found in Hewitt et al. (2012); Xin et al. (2017).
The best-fit parameters with the associated errors are shown in Table 3. For each parameter, the first error corresponds to the statistical error, while the second indicates the systematic error, obtained following the prescriptions developed in de Palma et al. (2013); Acero et al. (2016). The systematic errors also include uncertainties associated with the effective area8. The fluxes in the 300 MeV – 1 TeV energy band are FNE = (5.13 ± 0.08) × 10−11 erg cm−2 s−1 and FSW = (1.87 ± 0.035) × 10−11 erg cm−2 s−1 for the northeastern and southwestern sides, respectively.
We also analyzed the spectral shapes of the sources 4FGL J0822.8-4207 and PS J0824.0-4329. The γ–ray emission of both sources is significantly above the background, with TS = 99 for 4FGL J0822.8-4207 and TS = 23 for PS J0824.0-4329. In both cases, the SED can be fitted by a power law (Fig. 7). All best-fit parameters, together with the flux in the 300 MeV–1 TeV energy range, are summarized in Table 3. The results for 4FGL J0822.8-4207 are consistent with those reported in Araya et al. (2022).
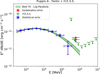 |
Fig. 5 Spectral energy distribution (SED) of Puppis A with the corresponding best-fit model and its uncertainties at the 68% confidence level (green curves and shaded region). Fermi upper limits are given at the 95% confidence level. Statistical and systematic errors are indicated in blue and red, respectively. Systematics errors for the Fermi upper limits present the extrema. The green arrows show the H.E.S.S. upper limits (H.E.S.S. Collaboration 2015). |
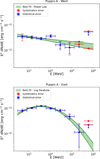 |
Fig. 6 Upper panel: spectral energy distribution (SED) of the southwestern side of Puppis A, with the corresponding best-fit model and its uncertainties at 68% confidence level (green curves and shaded region). Fermi upper limits are at the 95% confidence level. Statistical and systematic errors are indicated in blue and red, respectively. Systematics errors for the Fermi upper limits represent the extrema. Bottom panel: same as the upper panel for the northeastern side. |
4 Discussion
The morphological analysis described in Section 3.1 has revealed a clear asymmetry in the γ-ray emission of Puppis A: the northeastern region of the remnant, characterized by the brightest X-ray emission and enhanced ambient density, also shows the highest γ-ray emission. The asymmetry in the morphology of the source also appears to be reflected in a difference in the spectral shape of the two sides of the remnant, with the northeastern region exhibiting a curved spectrum, which can be fitted by the Log Parabola model, while the southwestern region shows an SED well described by a power-law fit (see Table 3). This suggests a possible difference in the physical origin of the γ-ray emission between the two sides.
We also analyzed two sources located outside the remnant: the northern source 4FGL J0822.8-4207 (previously detected by Ballet et al. 2020; Araya et al. 2022) and the southern source PS J0824.0-4329. Remarkably, the position of each of these sources corresponds to an enhancement in ambient density, as shown in Fig. 4. The two sources exhibit hard spectra that can be fitted by power laws (see Table 3).
The results of this project are divided into two main categories: the physical origin of the γ-ray emission from Puppis A and the physical origin of the two sources outside the remnant. These will be discussed separately.
Best-fit values for the spectral analysis in the 300 MeV–1 TeV energy band.
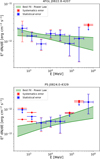 |
Fig. 7 Upper panel: spectral energy distribution (SED) of the source 4FGL J0822.8-4207 with the corresponding best-fit model and its uncertainties at the 68% confidence level (green curves and shaded region). Fermi upper limits are given at the 95% confidence level. Statistical and systematic errors are indicated in blue and red, respectively. Systematics errors for the Fermi upper limits represent the extrema. Bottom panel: same as the upper panel for the source PS J0824.0-4329. |
4.1 Physical origin of the γ-ray emission of Puppis A
As discussed above, Puppis A evolves in a highly inhomogeneous environment: while the ambient density is relatively low in the southwestern region of the shell, denser material and molecular clouds are observed at the northeastern edge of the remnant (see Aruga et al. 2022 and Fig. 4). It is therefore natural to speculate that the differing γ-ray properties in these two regions of the remnant result from the propagation of the shock through distinct environments.
As previously suggested by Hewitt et al. (2012); Xin et al. (2017), a leptonic origin of the γ-ray emission in Puppis A is strongly disfavored. Indeed, leptonic scenarios require an electron-to-proton ratio at least ten times higher than the standard cosmic-ray (CR) abundance. The IC-dominated model necessitates an extremely low density along with a relatively weak magnetic field, conditions that clearly do not apply to Puppis A. Additionally, the two spectral shapes (Fig. 6) suggest a hadronic scenario on both sides of the remnant.
Within this framework, it is plausible to consider two distinct populations of CRs (one in the southwest and one in the northeast of the remnant) associated with different acceleration mechanisms.
The southwestern region of Puppis A is known to be interacting with a relatively tenuous atomic cloud (Aruga et al. 2022), consistent with the faint X-ray and γ-ray emission observed in this region. Furthermore, eROSITA data indicate that the particle density of the X-ray emitting plasma in this region is the lowest across the remnant, on the order of ~1 cm−3 (Mayer et al. 2022). The propagation of the southwestern shock through such a low density environment renders the remnant dynamically young, allowing the shock to accelerate particles via diffusive shock acceleration (DSA). In this context, one can assume a power-law spectrum for the energy of the accelerated protons (E−2). We then synthesized the hadronic γ-ray emission (Kafexhiu et al. 2014) from this proton distribution, including an exponential cutoff at 1 TeV in the hadronic spectrum (see the upper panel of Fig. 8). The results remain largely unchanged for cutoff energies below 5 TeV. Such a low cut-off energy in the particle spectrum is consistent with previous findings H.E.S.S. Collaboration (2015). The resulting γ-ray flux can be written as (Gabici et al. 2009)
![Mathematical equation: $\[F_\gamma=2 \times 10^{-4}\left(\frac{E_{C R}}{10^{50} ~\mathrm{erg}}\right)\left(\frac{n}{\mathrm{~cm}^{-3}}\right)\left(\frac{D}{\mathrm{kpc}}\right)^{-2} \mathrm{MeV} \mathrm{~cm}^{-2} \mathrm{~s}^{-1}.\]$](/articles/aa/full_html/2025/09/aa55126-25/aa55126-25-eq5.png) (3)
(3)
Considering that the γ–ray flux from the southwestern region is FSW = (1.87 ± 0.035) × 10−11 erg cm−2 s−1, and assuming a distance D = 1.3 kpc (Reynoso et al. 2017) and an ambient density of n = 1 cm−3 (Mayer et al. 2022), the cosmic-ray energy is ECR ~ 1049 erg. The comparison between the data and the model is illustrated in the top panel of Fig. 8. This scenario (hereafter the “DSA model”) provides a very good description of the observed SED and a very reasonable value for the energy in the local cosmic rays.
In contrast, the northeastern region of Puppis A is interacting with a dense and massive molecular cloud (Aruga et al. 2022). Since the shock velocity is inversely proportional to the square root of the ambient density, the shock in this region is expected to be significantly slower than in the southwest. The low velocity of the shock propagating in a dense cloud (Vs < 200 km s−1) can render the shock radiative, leading to rapid compression of the shocked cloud material. Blandford & Cowie (1982) demonstrated that the reacceleration of preexisting CR electrons at a cloud shock, combined with subsequent adiabatic compression, results in enhanced synchrotron radiation, sufficient to explain the radio intensity observed in evolved SNRs. This reacceleration mechanism, along with the subsequent γ–ray emission via proton-proton collision with the compressed post-shock material, was then adapted by Uchiyama et al. (2010) to reproduce the γ–ray spectral properties of interacting remnants. This first scenario can explain the gamma-ray spectrum derived in our analysis of the northeastern side of Puppis A: the γ-ray emission, produced via proton–proton collision with the compressed post-shock material, is enhanced by the adiabatic compression of plasma to very high densities behind the shock. Moreover, the compression of preexisting CRs in the radiative shell enhances the CR spectrum by both energizing particles and increasing its normalization. The resulting spectrum of compressed CRs is as follows (Uchiyama et al. 2010):
![Mathematical equation: $\[n_{comp}(p)=\xi^{2 / 3} n_{G C R}(\xi^{1 / 3} p),\]$](/articles/aa/full_html/2025/09/aa55126-25/aa55126-25-eq6.png) (4)
(4)
where nGCR(p) is the density of Galactic cosmic rays, p is the momentum, ξ is the adiabatic compression ratio (nshell/n0r, where r is the shock compression ratio and nshell and n0 are the gas density in the shell and in the ambient medium, respectively). Preexisting CRs can also be reaccelerated at the shock front. In the case of shock-cloud interactions, this mechanism can enhance the γ-ray emission. Finally, only preexisting CRs can be responsible for γ-ray emission in SNRs interacting with MCs, without invoking particle acceleration at the shock.
Several parameters influence the resulting γ–ray emission. Here, we adopt those listed in Table 4 to synthesize the expected SED in this scenario (hereafter referred to as the reacceleration model). A crucial parameter is the upstream cloud density, which we set to 250 cm−3 based on the analysis by Aruga et al. (2022). The cloud filling factor reported in Table 4 refers exclusively to the shocked cloud, which explains its low value. Although distance, age and radius were set according to what was reported in the literature (see Section 1), other parameters, still uncertain, were assigned reasonable, ad hoc values. The bottom panel of Fig. 8 shows the comparison between the observed SED and the reacceleration model. The model provides a good fit to the data, accurately reproducing the observed curvature of the SED. In particular, the proton cutoff energy needed to reproduce the northeastern data (600 GeV; see Table 4) is only a few times lower than the cutoff energy of the protons in the DSA model adopted in the southwest (1–5 TeV).
However, we caution that the model in Uchiyama et al. (2010) is not applicable for very low shock velocities. Measurements of CO and HI by Aruga et al. (2022) suggest a shock velocity of approximately 10 km s−1, which falls outside the suitable regime for the reacceleration model described above. In this case, the most suitable approach involves particle acceleration driven by the reflected shock, as described in Inoue et al. (2012) for the supernova remnant RX J1713.7-3946. In this scenario, considering a shock velocity of approximately 10 km s−1 and a cloud average density of 250 cm−3, the density of the diffuse gas required to drive this shock into the cloud (for shock velocities around 1000 km s−1) is approximately 0.02 cm−3, much lower than the value estimated from X-ray emission (n ~ 1 cm−3 in Mayer et al. 2022).
To confirm the fitting models, realistic models that also include contributions from, for example, primary and secondary electron radiation, along with a comparison to radio data, need to be analyzed for both acceleration and reacceleration models.
An alternative scenario would invoke the DSA model for both sides of the remnant. The shapes of the two SEDs shown in Fig. 8 are similar, which might suggest applying a DSA model to fit the northeastern SED as well. Assuming the same value of ECR for both regions, the northeast-to-southwest flux ratio (FNE/FSW = f ≈ 2.8) could be accounted for by a similar ratio f in the ambient densities, with the density in the northeast being only a factor of <3 larger than in the southwest. Such a difference in the ambient density can be related to a similar ratio of absorption along the line of sight, consistent with Aruga et al. (2022). We note that the density contrast of the X-ray-emitting plasma between the northeastern and southwestern sides of Puppis A is on the order of nNE/nSW ≈ 4–5 (Mayer et al. 2022), which is comparable to f. According to Eq. (3), given the much higher particle density, an unrealistically low cosmic-ray energy ECR ~ 1047 erg would be necessary at the northeast to explain the observed flux FNE within the DSA model. This CR energy is indeed too low for particles accelerated via DSA and is also smaller than that obtained for the southwestern side. However, cosmic-ray energies of approximately 1047 erg in SNRs have been previously reported in Aruga et al. (2022); Fukui et al. (2021), where both the filling factor and the CR escape outside the shell were invoked to explain cosmic-ray energies much smaller than 1049. Caution is warranted when assuming that the entire northeastern shock front is interacting with the cloud. Indeed, the fraction of the shock that interacts with the cloud remains uncertain. Protons in the HI medium and in the low-density ambient medium can both act as targets in the proton-proton reaction. If we assume that both are located in a similar position within the SNR, the high density will enhance the gamma-ray emission. This situation can occur if the two gases with different densities have complementary distributions. However, the presence of HI clumps embedded in tenuous hot gas cannot be resolved at the current HI resolution. In conclusion, the scenario considering canonical DSA on both sides of the remnant presents several issues: (i) it does not provide realistic values of the CR energy, unless the shock-cloud interaction observed by Aruga et al. (2022) is neglected; (ii) even excluding shock-cloud interaction, the model fails to fully explain the differences in γ–ray flux between the northeastern and southwestern regions in terms of the density contrast observed in X-rays. However, this scenario, though less likely, cannot be definitively ruled out at present.
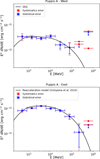 |
Fig. 8 Top panel: spectral energy distribution (SED) of the southwestern side of Puppis A (same as the top panel in Fig. 6). The black curve shows the hadronic emission expected from a power-law distribution of proton energies (E−2) with a cutoff at 1 TeV. Bottom panel: spectral energy distribution (SED) of the northeastern side of Puppis A (same as the bottom panel in Fig. 6). The black curve shows the hadronic emission expected from the reacceleration model (see Table 4 for the model parameters). |
Parameters used to define the crushed-cloud reacceleration model (Uchiyama et al. 2010) for Puppis A.
4.2 Physical origin of the γ-ray emission from 4FGL J0822.8-4207 and PS J0824.0-4329
Figure 9 presents a close-up view of the regions around 4FGL J0822.8-4207 (top panel) and PS J0824.0-4329 (bottom panel) on the map of the ISM proton column density, extracted in the velocity range 8–20 km s−1, corresponding to the distance of Puppis A (see also Fig. 4 and Fig. 8 in Aruga et al. 2022). The figure clearly reveals that both sources are associated with dense clumps of interstellar medium. These two γ-ray excesses, located outside the remnant, are therefore interesting sources whose emission can be explained as the result of CRs accelerated and escaped from the remnant, now diffusing in nearby molecular clouds. This scenario was proposed by Araya et al. (2022) for 4FGL J0822.8-4207 (although an alternative explanation was also proposed, considering the Herbig-Haro object HH 219 as the origin of the GeV source). We stress that, in disagreement with Araya et al. (2022), who classified 4FGL J0822.8-4207 as a point-like source, we find that the source is extended (see Section 3.2). Here, we discuss whether the γ–ray emission of both 4FGL J0822.8-4207 and the previously undetected putative source PS J0824.0-4329 can indeed be associated with CRs diffusing in nearby clouds.
We estimated the diffusion length of CRs with energy E that have escaped from Puppis A and are moving in the local ISM with magnetic field B, using ![Mathematical equation: $\[l_{d}=2 \sqrt{D \tau_{S N R}}\]$](/articles/aa/full_html/2025/09/aa55126-25/aa55126-25-eq7.png) , where the diffusion coefficient D is given by (Gabici et al. 2009)
, where the diffusion coefficient D is given by (Gabici et al. 2009)
![Mathematical equation: $\[D=3 \times 10^{27}(E / 1 ~\mathrm{GeV})^{1 / 2}(\mathrm{B} / 3 ~\mu \mathrm{G})^{-1 / 2},\]$](/articles/aa/full_html/2025/09/aa55126-25/aa55126-25-eq8.png) (5)
(5)
and τSNR = 4 kyr is the age of Puppis A. Assuming a typical interstellar magnetic field of B = 3 μG and CRs with energy E = 10 GeV, we obtain ld ~ 22 pc. The projected distance between 4FGL J0822.8-4207 and the center of Puppis A is ~19 pc, while that of PS J0824.0-4329 is ~16 pc. Both γ-ray sources (and the dense clouds) lie within ld, assuming no offset along the line of sight. Therefore, CRs escaping from Puppis A can reach them. It is therefore possible that the observed γ–ray emission arises from proton-proton collisions between escaped CRs and the dense cloud material.
In this scenario, the energy density of the CRs inside the clouds can be estimated from the γ–ray fluxes observed for the two sources, as reported in Sect. 3.2. We assume that the escaped CRs are uniformly distributed within a sphere of radius ld, with an energy density ![Mathematical equation: $\[w_{C R}=W_{C R} /(\frac{4}{3} \pi l_{d}^{3})\]$](/articles/aa/full_html/2025/09/aa55126-25/aa55126-25-eq9.png) , where WCR is the CR energy. For a cloud with volume Vcl and density ncl, the γ–ray luminosity can be estimated as (Gabici et al. 2009)
, where WCR is the CR energy. For a cloud with volume Vcl and density ncl, the γ–ray luminosity can be estimated as (Gabici et al. 2009)
![Mathematical equation: $\[L_\gamma=\frac{w_{C R} V_{c l}}{3 \tau_{p p}}.\]$](/articles/aa/full_html/2025/09/aa55126-25/aa55126-25-eq10.png) (6)
(6)
Here, τpp is the mean time interval between proton-proton collisions and scales as 1/ncl (τpp = 1/(ngasσppkc), where σpp = 4 × 10⁻²⁶ cm2, k=0.45, and c is the speed of light. We estimated the values of Vcl and ncl, as follows. We consider the cloud associated with 4FGL J0822.8-4207 to be composed of three spherical clouds, whose projected sizes in the plane of the sky are indicated by the three circles (3′ in radius each) shown in the top panel of Fig. 9. The radius of each circle corresponds to 1.1 pc at 1.3 kpc. Within each circle, we calculated the excess in the proton column density with respect to a “background” value of 3 × 1021 cm−2, and derived the proton density accordingly. We find ncl1 ~ 900 cm−3, ncl2 ~ 2000 cm−3, and ncl3 ~ 1400 cm−3 for clouds 1, 2, 3 of Fig. 9, respectively. By inserting these values into Eq. (6) and considering the γ–ray luminosity of 4FGL J0822.8-4207, we obtain an energy density wCR ~ 7 eV cm−3. We applied the same methodology for PS J0824.0-4329, by approximating the cloud as an ellipsoid, whose projected shape in the plane of the sky is shown in the bottom panel of Fig. 9 (with semi-axes a = 1.62 pc and b = c = 0.68 pc). We find ncl ~ 1900 cm−3 and wCR ~ 7 eV cm−3. Remarkably, we find the same values of wCR in the two sources, which are located on opposite sides of Puppis A. In this scenario, we obtain WCR ~ 1.5 × 1049 erg, which is comparable to the value obtained from the analysis of the Puppis A SED (see Sect. 4). We caution that ECR and WCR represent the CR energies at the source and within the clouds, respectively, and do not necessarily need to have the same value.
Moreover, the cosmic-ray energy density around Puppis A significantly exceeds the average value in the Milky Way, (![Mathematical equation: $\[\overline{w_{C R}}=1.8 ~\mathrm{eV}/\mathrm{cm}^{3}\]$](/articles/aa/full_html/2025/09/aa55126-25/aa55126-25-eq11.png) Webber 1998). This result strongly indicates that the γ-ray emission of 4FGL J0822.8-4207 and PS J0824.0-4329 originates from CRs escaped from the nearby SNR Puppis A and interacting with dense clouds. If these sources are indeed linked to Puppis A, their spatial distribution suggests that the escape of cosmic rays from the shell of Puppis A occurs anisotropically along the magnetic field lines. Indeed, bright γ-ray sources are expected in regions of high ambient density, toward the northeastern region of Puppis A. The non-detection of γ-ray sources in that direction suggests that the B field around Puppis A is preferentially oriented north-south.
Webber 1998). This result strongly indicates that the γ-ray emission of 4FGL J0822.8-4207 and PS J0824.0-4329 originates from CRs escaped from the nearby SNR Puppis A and interacting with dense clouds. If these sources are indeed linked to Puppis A, their spatial distribution suggests that the escape of cosmic rays from the shell of Puppis A occurs anisotropically along the magnetic field lines. Indeed, bright γ-ray sources are expected in regions of high ambient density, toward the northeastern region of Puppis A. The non-detection of γ-ray sources in that direction suggests that the B field around Puppis A is preferentially oriented north-south.
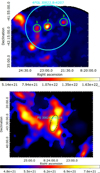 |
Fig. 9 Close-up view of the map of the distributions of ISM proton column densities, Np(H2 + HI), in Fig. 4, centered on 4FGL J0822.8-4207 (top panel) and PS J0824.0-4329 (bottom panel). The green regions in the top panel and the dashed black region in the bottom panel mark the regions used to measure the volume of the interacting cloud. |
5 Conclusions
This paper focuses on the study of the γ-ray emission from the Galactic SNR Puppis A and its surrounding area. We present a new analysis of Fermi-LAT observations, taking advantage of the high statistical quality of the data.
We confirm the asymmetric γ-ray emission of Puppis A, characterized by a bright northeastern region and a dim southwestern region, consistent with previous findings Hewitt et al. (2012); Xin et al. (2017). We find that the X-ray morphology, particularly the eROSITA map in the 0.7–1 keV band provides the best spatial template to reproduce the γ-ray map once corrected for interstellar absorption (see Table 2). Thanks to the improved data quality, we were able to perform a spatially resolved spectral analysis, which reveals a hint of spectral shape variation between the northeastern and southwestern regions of the remnant. In particular, the new data reveal, for the first time, a significant curvature in the spectrum of the northeastern region of Puppis A. Because this difference is indicative of two different population of CRs accelerated in the two regions, we investigated whether it reflects different acceleration mechanisms operating in different regions of Puppis A. Motivated by strong indications of interaction between the northeastern region and a massive molecular cloud Aruga et al. (2022), we explored the possibility of reacceleration of ambient cosmic rays in the radiative shock propagating into the cloud, adopting the model proposed by Uchiyama et al. (2010), as well as the reflected shock scenario in young SNRs proposed by Inoue et al. (2012). Although the reacceleration model accurately reproduces the observed SED of the northeastern region of Puppis A, it conflicts with the low shock velocities measured by Aruga et al. (2022), which require an alternative approach invoking particle acceleration by reflected shocks (Inoue et al. 2012). However, the reflected shock scenario would imply the presence of X-ray synchrotron emission, which has not been detected in Puppis A. Thus, the question of the mechanism governing particle acceleration in the northeastern region of the remnant remains uncertain, leaving multiple open questions regarding SNRs interacting with molecular clouds. However, as shown in Sect. 4.1, we suggest that the physical mechanism responsible for particle acceleration in the northeastern region of Puppis A must differ from the canonical DSA that perfectly reproduces the γ-ray emission from the southwestern side. The latter evolves in a more tenuous environment, and its (dim) γ–ray emission can be naturally explained as hadronic emission from particles accelerated via DSA. This scenario, considering two different CR populations between southwestern and northeastern regions, provides a self-consistent explanation of Puppis A’s observed γ–ray emission and physically plausible values for the CR total energy. Explaining both the northeastern and southwestern SEDs of Puppis A with a single acceleration mechanism (DSA) is considerably more challenging and problematic, although it cannot yet be definitively ruled out. Although Puppis A is a relatively young SNR, it does not accelerate particles up to multi-TeV energies, as indicated by the non-detection with H.E.S.S. and the cutoff energy of the particle spectrum at E < 1 TeV.
Moreover, we conducted an in-depth analysis of the γ-ray source 4FGL J0822.8-4207, located beyond the northern border of Puppis A, and identified a putative new source, namely PS J0824.0-4329, located to the south of the shell. We find that 4FGL J0822.8-4207 is an extended source, and we analyzed the SED of both sources. The analysis shows that both sources are associated with dense interstellar clumps and their γ-ray emission is the result of a high-energy density of cosmic rays therein. Specifically, considering the diffusion length of CRs escaped from Puppis A, we associate 4FGL J0822.8-4207 and PS J0824.0-4329 with inelastic proton-proton collisions between hadrons accelerated in Puppis A and the cloud material.
Data availability
The images in FITS format are available at the CDS via https://cdsarc.cds.unistra.fr/viz-bin/cat/J/A+A/701/A206.
Acknowledgements
The Fermi LAT Collaboration acknowledges generous ongoing support from a number of agencies and institutes that have supported both the development and the operation of the LAT as well as scientific data analysis. These include the National Aeronautics and Space Administration and the Department of Energy in the United States, the Commissariat à l’Energie Atomique and the Centre National de la Recherche Scientifique/Institut National de Physique Nucléaire et de Physique des Particules in France, the Agenzia Spaziale Italiana and the Istituto Nazionale di Fisica Nucleare in Italy, the Ministry of Education, Culture, Sports, Science and Technology (MEXT), High Energy Accelerator Research Organization (KEK) and Japan Aerospace Exploration Agency (JAXA) in Japan, and the K. A. Wallenberg Foundation, the Swedish Research Council and the Swedish National Space Board in Sweden. Additional support for science analysis during the operations phase is gratefully acknowledged from the Istituto Nazionale di Astrofisica in Italy and the Centre National d’Études Spatiales in France. This work performed in part under DOE Contract DE-AC02-76SF00515. We acknowledge Jean Ballet and Fabio Acero for the support they gave on the project. We also acknowledge Juan Luna and Gloria Dubner for providing the XMM-Newton maps. This paper is partially supported by the Fondazione ICSC, Spoke 3 Astrophysics and Cosmos Observations. National Recovery and Resilience Plan (Piano Nazionale di Ripresa e Resilienza, PNRR) Project ID CN_00000013 “Italian Research Center on High-Performance Computing, Big Data and Quantum Computing” funded by MUR Missione 4 Componente 2 Investimento 1.4: Potenziamento strutture di ricerca e creazione di “campioni nazionali di R&S (M4C2-19)” – Next Generation EU (NGEU). This work was supported by JSPS KAKENHI grant numbers 20KK0309 and 24H00246.
Appendix A SEDs with statistical and systematics error
We here show SED data points with only statistical (in blue) and only systematics (in red) error bars. The combined plot are shown in Sect. 3, 4 and Fig. 5, 6, 7.
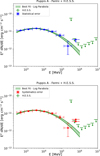 |
Fig. A.1 SED of Puppis A with the corresponding best fit model and its uncertainties at 68% confidence level (green curves and shaded region). Fermi upper limits are at 95% confidence level. The green arrows show the H.E.S.S. upper limits (H.E.S.S. Collaboration 2015). top panel shows statistical errors, bottom panel shows systematics errors. |
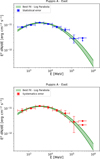 |
Fig. A.2 SED of the northeastern side of Puppis A, with the corresponding best fit model and its uncertainties at 68% confidence level (green curves and shaded region). Fermi upper limits are at 95% confidence level. top panel shows statistical errors, bottom panel shows systematics errors. |
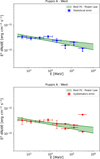 |
Fig. A.3 SED of the southwestern side of Puppis A, with the corresponding best fit model and its uncertainties at 68% confidence level (green curves and shaded region). Fermi upper limits are at 95% confidence level. Top panel shows statistical errors, bottom panel shows systematics errors. |
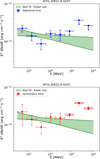 |
Fig. A.4 SED of the source 4FGL J0822.8-4207 with the corresponding best fit model and its uncertainties at 68% confidence level (green curves and shaded region). Fermi upper limits are at 95% confidence level. Top panel shows statistical errors, bottom panel shows systematics errors. |
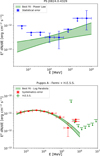 |
Fig. A.5 SED of the source PS J0824.0-4329. with the corresponding best fit model and its uncertainties at 68% confidence level (green curves and shaded region). Fermi upper limits are at 95% confidence level. Top panel shows statistical errors, bottom panel shows systematics errors. |
References
- Abdollahi, S., Acero, F., Baldini, L., et al. 2022, ApJS, 260, 53 [NASA ADS] [CrossRef] [Google Scholar]
- Acero, F., Ackermann, M., Ajello, M., et al. 2016, ApJS, 223, 26 [Google Scholar]
- Aharonian, F. A., & Atoyan, A. M. 1996, A&A, 309, 917 [Google Scholar]
- Akaike, H. 1998, Information Theory and an Extension of the Maximum Likelihood Principle, eds. E. Parzen, K. Tanabe, & G. Kitagawa (New York, NY: Springer New York), 199 [Google Scholar]
- Araya, M., Gutiérrez, L., & Kerby, S. 2022, MNRAS, 510, 2277 [NASA ADS] [CrossRef] [Google Scholar]
- Aruga, M., Sano, H., Fukui, Y., et al. 2022, ApJ, 938, 94 [Google Scholar]
- Ballet, J., Burnett, T. H., Digel, S. W., & Lott, B. 2020, arXiv e-prints [arXiv:2005.11208] [Google Scholar]
- Ballet, J., Bruel, P., Burnett, T. H., Lott, B., & The Fermi-LAT collaboration 2023, arXiv e-prints [arXiv:2307.12546] [Google Scholar]
- Becker, W., Prinz, T., Winkler, P. F., & Petre, R. 2012, ApJ, 755, 141 [NASA ADS] [CrossRef] [Google Scholar]
- Blandford, R. D., & Cowie, L. L. 1982, ApJ, 260, 625 [NASA ADS] [CrossRef] [Google Scholar]
- Cardillo, M., Amato, E., & Blasi, P. 2016, A&A, 595, A58 [NASA ADS] [CrossRef] [EDP Sciences] [Google Scholar]
- Castelletti, G., Dubner, G., Golap, K., & Goss, W. M. 2006, A&A, 459, 535 [NASA ADS] [CrossRef] [EDP Sciences] [Google Scholar]
- de Palma, F., Brandt, T. J., Johannesson, G., & Tibaldo, L. 2013, arXiv e-prints, [arXiv:1304.1395] [Google Scholar]
- Dubner, G. M., & Arnal, E. M. 1988, A&AS, 75, 363 [NASA ADS] [Google Scholar]
- Dubner, G. M., Braun, R., Winkler, P. F., & Goss, W. M. 1991, AJ, 101, 1466 [Google Scholar]
- Dubner, G., Loiseau, N., Rodríguez-Pascual, P., et al. 2013, A&A, 555, A9 [CrossRef] [EDP Sciences] [Google Scholar]
- Fukui, Y., Sano, H., Yamane, Y., et al. 2021, ApJ, 915, 84 [CrossRef] [Google Scholar]
- Gabici, S., & Aharonian, F. A. 2007, ApJ, 665, L131 [NASA ADS] [CrossRef] [Google Scholar]
- Gabici, S., Aharonian, F. A., & Casanova, S. 2009, MNRAS, 396, 1629 [Google Scholar]
- H.E.S.S. Collaboration (Abramowski, A., et al.) 2015, A&A, 575, A81 [NASA ADS] [CrossRef] [EDP Sciences] [Google Scholar]
- Hewitt, J. W., Grondin, M. H., Lemoine-Goumard, M., et al. 2012, ApJ, 759, 89 [NASA ADS] [CrossRef] [Google Scholar]
- Hwang, U., Flanagan, K. A., & Petre, R. 2005, ApJ, 635, 355 [NASA ADS] [CrossRef] [Google Scholar]
- Hwang, U., Petre, R., & Flanagan, K. A. 2008, ApJ, 676, 378 [NASA ADS] [CrossRef] [Google Scholar]
- Inoue, T., Yamazaki, R., Inutsuka, S.-i., & Fukui, Y. 2012, ApJ, 744, 71 [NASA ADS] [CrossRef] [Google Scholar]
- Kafexhiu, E., Aharonian, F., Taylor, A. M., & Vila, G. S. 2014, Phys. Rev. D, 90, 123014 [Google Scholar]
- Katsuda, S., Mori, K., Tsunemi, H., et al. 2008, ApJ, 678, 297 [NASA ADS] [CrossRef] [Google Scholar]
- Katsuda, S., Hwang, U., Petre, R., et al. 2010, ApJ, 714, 1725 [NASA ADS] [CrossRef] [Google Scholar]
- Lande, J., Ackermann, M., Allafort, A., et al. 2012, ApJ, 756, 5 [NASA ADS] [CrossRef] [Google Scholar]
- Luna, G. J. M., Smith, M. J. S., Dubner, G., Giacani, E., & Castelletti, G. 2016, A&A, 590, A70 [NASA ADS] [CrossRef] [EDP Sciences] [Google Scholar]
- Mattox, J. R., Bertsch, D. L., Chiang, J., et al. 1996, ApJ, 461, 396 [Google Scholar]
- Mayer, M., Becker, W., Patnaude, D., Winkler, P. F., & Kraft, R. 2020, ApJ, 899, 138 [Google Scholar]
- Mayer, M. G. F., Becker, W., Predehl, P., Sasaki, M., & Freyberg, M. 2022, A&A, 661, A31 [NASA ADS] [CrossRef] [EDP Sciences] [Google Scholar]
- Mitchell, A. M. W., Rowell, G. P., Celli, S., & Einecke, S. 2021, MNRAS, 503, 3522 [NASA ADS] [CrossRef] [Google Scholar]
- Ohira, Y., Murase, K., & Yamazaki, R. 2011, MNRAS, 410, 1577 [NASA ADS] [Google Scholar]
- Reynoso, E. M., Cichowolski, S., & Walsh, A. J. 2017, MNRAS, 464, 3029 [Google Scholar]
- Tutone, A., Ballet, J., Acero, F., D’Aì, A., & Cusumano, G. 2021, A&A, 656, A139 [NASA ADS] [CrossRef] [EDP Sciences] [Google Scholar]
- Uchiyama, Y., Blandford, R. D., Funk, S., Tajima, H., & Tanaka, T. 2010, ApJ, 723, L122 [NASA ADS] [CrossRef] [Google Scholar]
- Webber, W. R. 1998, ApJ, 506, 329 [NASA ADS] [CrossRef] [Google Scholar]
- Winkler, P. F., Tuttle, J. H., Kirshner, R. P., & Irwin, M. J. 1988, in IAU Colloq. 101: Supernova Remnants and the Interstellar Medium, eds. R. S. Roger, & T. L. Landecker, 65 [Google Scholar]
- Wood, M., Caputo, R., Charles, E., et al. 2017, in International Cosmic Ray Conference, 301, 35th International Cosmic Ray Conference (ICRC2017), 824 [Google Scholar]
- Xin, Y.-L., Guo, X.-L., Liao, N.-H., et al. 2017, ApJ, 843, 90 [NASA ADS] [CrossRef] [Google Scholar]
We note that for the morphological analysis we investigated different spatial templates for Puppis A assuming its spectral shape is a LogParabola (see Sect. 3.3).
For every source we count the spatial and spectral parameters. For the spatial coordinates the disk includes center and radius, while the point-like sources include their center. The spectral shape of Puppis A (Disk or image) always includes three parameters (N0, α, β, see Eq. (1)), while point-like sources have only two parameters (N0, γ, see Eq. (2)).
We do not consider the ROSAT observation as in Hewitt et al. (2012) because nearly 20% of the emission in the southern part of the remnant was been detected, as shown in Dubner et al. (2013).
The effects of absorption are expected to be smaller in the hard X-rays.
All Tables
Comparison of spatial models used to fit the morphology of Puppis A between 1 GeV and 1 TeV.
Parameters used to define the crushed-cloud reacceleration model (Uchiyama et al. 2010) for Puppis A.
All Figures
|
Fig. 1 Left panel: Fermi-LAT TS map showing the γ-ray emission of Puppis A. The white circle marks the uniform disk used to fit Puppis A in 4FGL-DR3. The green contours mark the contour levels at 1% and 10% of the maximum of the eROSITA map (Mayer et al. 2022). Central panel: same as left panel but with radio VLA contours at 7% and 15% of the maximum of the VLA map. Right panel: residual TS map obtained by fitting the ROI (see text) using the disk template shown in the top panel. The red circle shows the uniform disk that models Puppis A (same as the white circle in the top panel), the red cross indicates the source 4FGL-J0822.8-4207 and the green crosses indicate the new sources needed to fit the gamma-ray excesses (Table 1). |
| In the text | |
|
Fig. 2 Left panel: eROSITA unabsorbed flux image in erg/s/cm2/arcmin2 in the 0.7–1 keV band, with square-root scaling. The yellow line marks the separation between northeastern and southwestern side (see text). Right panel: residual TS map in which the morphology of Puppis A is fit with the template in the top panel and the source 4FGL J0822.8-4207 is considered as an extended source. |
| In the text | |
|
Fig. 3 Residual TS map showing the two γ-ray sources located outside Puppis A: 4FGL J0822.8-4207 to the north and PS J0824.0-4329 to the south. |
| In the text | |
|
Fig. 4 Map of the distributions of the ISM proton column densities, Np(H2 + HI), in the velocity range of 8–20 km s−1 (see Fig. 8 in Aruga et al. 2022). White contours map the soft X-ray emission of Puppis A, and the two cyan regions mark the two γ-ray excesses found outside from the remnant. |
| In the text | |
|
Fig. 5 Spectral energy distribution (SED) of Puppis A with the corresponding best-fit model and its uncertainties at the 68% confidence level (green curves and shaded region). Fermi upper limits are given at the 95% confidence level. Statistical and systematic errors are indicated in blue and red, respectively. Systematics errors for the Fermi upper limits present the extrema. The green arrows show the H.E.S.S. upper limits (H.E.S.S. Collaboration 2015). |
| In the text | |
|
Fig. 6 Upper panel: spectral energy distribution (SED) of the southwestern side of Puppis A, with the corresponding best-fit model and its uncertainties at 68% confidence level (green curves and shaded region). Fermi upper limits are at the 95% confidence level. Statistical and systematic errors are indicated in blue and red, respectively. Systematics errors for the Fermi upper limits represent the extrema. Bottom panel: same as the upper panel for the northeastern side. |
| In the text | |
|
Fig. 7 Upper panel: spectral energy distribution (SED) of the source 4FGL J0822.8-4207 with the corresponding best-fit model and its uncertainties at the 68% confidence level (green curves and shaded region). Fermi upper limits are given at the 95% confidence level. Statistical and systematic errors are indicated in blue and red, respectively. Systematics errors for the Fermi upper limits represent the extrema. Bottom panel: same as the upper panel for the source PS J0824.0-4329. |
| In the text | |
|
Fig. 8 Top panel: spectral energy distribution (SED) of the southwestern side of Puppis A (same as the top panel in Fig. 6). The black curve shows the hadronic emission expected from a power-law distribution of proton energies (E−2) with a cutoff at 1 TeV. Bottom panel: spectral energy distribution (SED) of the northeastern side of Puppis A (same as the bottom panel in Fig. 6). The black curve shows the hadronic emission expected from the reacceleration model (see Table 4 for the model parameters). |
| In the text | |
|
Fig. 9 Close-up view of the map of the distributions of ISM proton column densities, Np(H2 + HI), in Fig. 4, centered on 4FGL J0822.8-4207 (top panel) and PS J0824.0-4329 (bottom panel). The green regions in the top panel and the dashed black region in the bottom panel mark the regions used to measure the volume of the interacting cloud. |
| In the text | |
|
Fig. A.1 SED of Puppis A with the corresponding best fit model and its uncertainties at 68% confidence level (green curves and shaded region). Fermi upper limits are at 95% confidence level. The green arrows show the H.E.S.S. upper limits (H.E.S.S. Collaboration 2015). top panel shows statistical errors, bottom panel shows systematics errors. |
| In the text | |
|
Fig. A.2 SED of the northeastern side of Puppis A, with the corresponding best fit model and its uncertainties at 68% confidence level (green curves and shaded region). Fermi upper limits are at 95% confidence level. top panel shows statistical errors, bottom panel shows systematics errors. |
| In the text | |
|
Fig. A.3 SED of the southwestern side of Puppis A, with the corresponding best fit model and its uncertainties at 68% confidence level (green curves and shaded region). Fermi upper limits are at 95% confidence level. Top panel shows statistical errors, bottom panel shows systematics errors. |
| In the text | |
|
Fig. A.4 SED of the source 4FGL J0822.8-4207 with the corresponding best fit model and its uncertainties at 68% confidence level (green curves and shaded region). Fermi upper limits are at 95% confidence level. Top panel shows statistical errors, bottom panel shows systematics errors. |
| In the text | |
|
Fig. A.5 SED of the source PS J0824.0-4329. with the corresponding best fit model and its uncertainties at 68% confidence level (green curves and shaded region). Fermi upper limits are at 95% confidence level. Top panel shows statistical errors, bottom panel shows systematics errors. |
| In the text | |
Current usage metrics show cumulative count of Article Views (full-text article views including HTML views, PDF and ePub downloads, according to the available data) and Abstracts Views on Vision4Press platform.
Data correspond to usage on the plateform after 2015. The current usage metrics is available 48-96 hours after online publication and is updated daily on week days.
Initial download of the metrics may take a while.