Fig. 2
Download original image
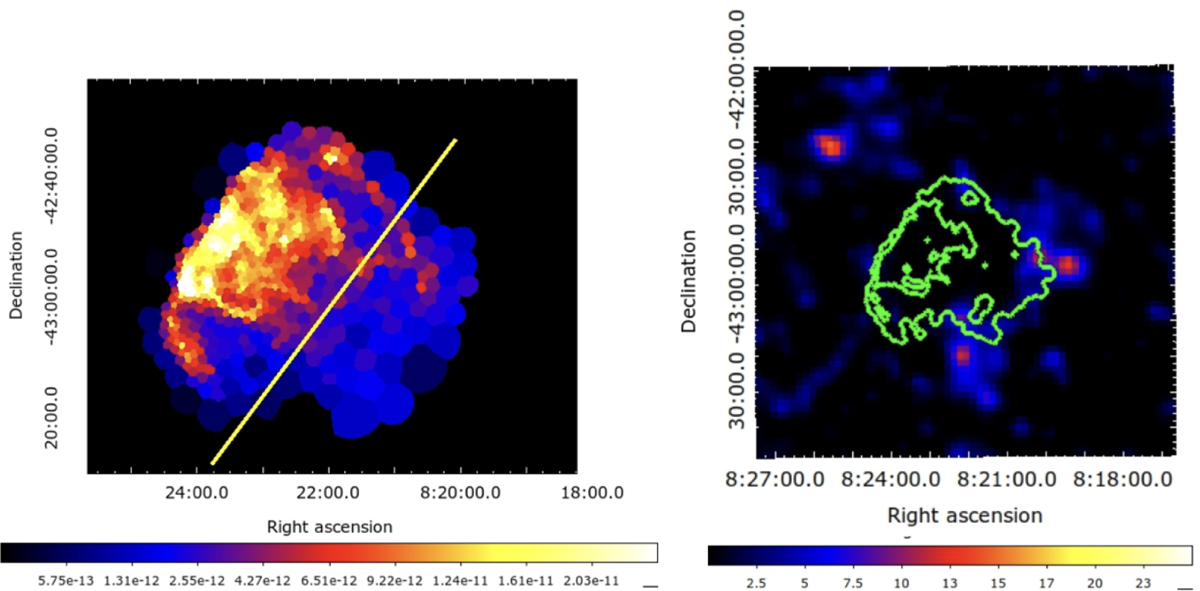
Left panel: eROSITA unabsorbed flux image in erg/s/cm2/arcmin2 in the 0.7–1 keV band, with square-root scaling. The yellow line marks the separation between northeastern and southwestern side (see text). Right panel: residual TS map in which the morphology of Puppis A is fit with the template in the top panel and the source 4FGL J0822.8-4207 is considered as an extended source.
Current usage metrics show cumulative count of Article Views (full-text article views including HTML views, PDF and ePub downloads, according to the available data) and Abstracts Views on Vision4Press platform.
Data correspond to usage on the plateform after 2015. The current usage metrics is available 48-96 hours after online publication and is updated daily on week days.
Initial download of the metrics may take a while.