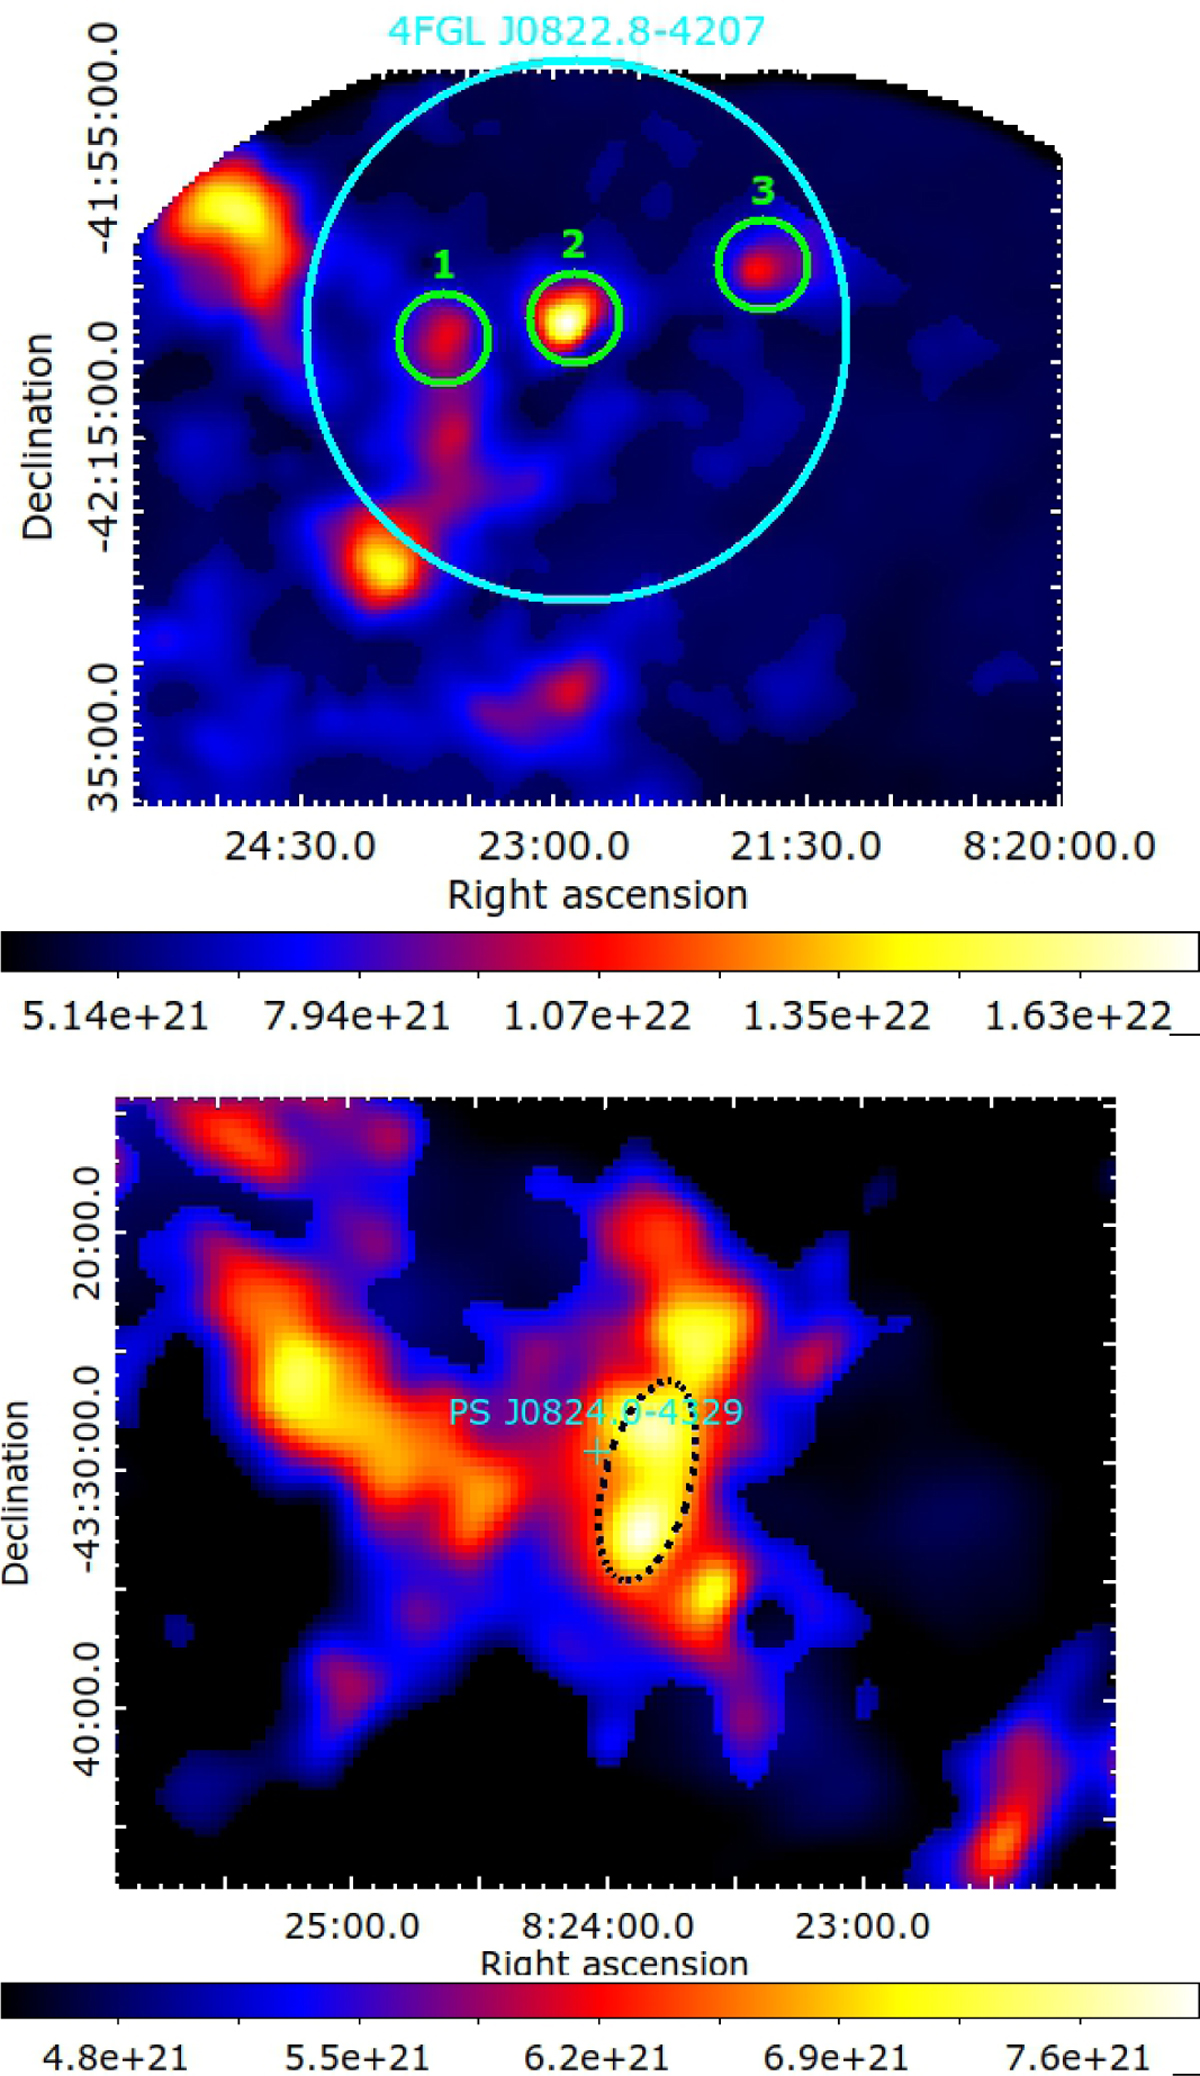
Fig. 9
Download original image
Close-up view of the map of the distributions of ISM proton column densities, Np(H2 + HI), in Fig. 4, centered on 4FGL J0822.8-4207 (top panel) and PS J0824.0-4329 (bottom panel). The green regions in the top panel and the dashed black region in the bottom panel mark the regions used to measure the volume of the interacting cloud.
Current usage metrics show cumulative count of Article Views (full-text article views including HTML views, PDF and ePub downloads, according to the available data) and Abstracts Views on Vision4Press platform.
Data correspond to usage on the plateform after 2015. The current usage metrics is available 48-96 hours after online publication and is updated daily on week days.
Initial download of the metrics may take a while.