| Issue |
A&A
Volume 701, September 2025
|
|
|---|---|---|
| Article Number | A21 | |
| Number of page(s) | 9 | |
| Section | Astrophysical processes | |
| DOI | https://doi.org/10.1051/0004-6361/202555186 | |
| Published online | 28 August 2025 | |
Supernova explosions of runaway stars and young neutron stars above the Galactic plane
1
Dipartimento di Fisica e Astronomia “G. Galilei”, Università di Padova, Via Marzolo 8, 35121, Padova, Italy
2
Sternberg Astronomical Institute, Lomonosov Moscow State University, Universitetsky prospekt 13, 119234, Moscow, Russia
3
Mullard Space Science Laboratory, University College London, Holmbury St Mary, Dorking, Surrey, RH5 6NT, UK
⋆ Corresponding author.
Received:
17
April
2025
Accepted:
11
July
2025
Abstract
Context. Several supernova remnants and young neutron stars were recently discovered relatively high above the Galactic plane. Understanding their origin will provide key insights into the properties of the Galactic halo. One possibility is that they originated from runaway OB stars born in the Galactic disk.
Aims. We aim to determine the spatial distribution of supernova explosions from runaway OB stars and to assess whether this model can explain certain observed neutron stars.
Methods. We mapped the distribution of supernova events produced by runaway OB stars by incorporating their birth rate, initial spatial distribution, lifetime, ejection mechanisms, and velocity distributions. By tracking their motion in the Galactic potential, we determined their final distribution right before the explosion.
Results. We show that the neutron star Calvera, which is found at z ≈ 2.2 kpc, could have originated from a runaway OB star. In addition, we compared the probabilities of finding a supernova remnant originating from Type Ia and core-collapse supernovae high above the Galactic plane, finding that supernova remnants related to core-collapse supernovae outnumber those related to Type Ia supernovae.
Key words: stars: early-type / stars: kinematics and dynamics / stars: massive / stars: neutron / supernovae: general
© The Authors 2025
 Open Access article, published by EDP Sciences, under the terms of the Creative Commons Attribution License (https://creativecommons.org/licenses/by/4.0), which permits unrestricted use, distribution, and reproduction in any medium, provided the original work is properly cited.
This article is published in open access under the Subscribe to Open model. This email address is being protected from spambots. You need JavaScript enabled to view it. to support open access publication.
1. Introduction
Star formation in the Milky Way (MW) is believed to be confined to the Galactic disk, mostly in the so-called star-forming regions. Thus, the youngest stellar population is mainly observed in structures such as OB associations and open clusters. In the photometric survey by Humason & Zwicky (1947), faint blue stars at high Galactic latitudes were identified. They are low-mass, evolved Population II objects. Further studies have shown that main-sequence (MS) stars are also present in the Galactic halo, although they appear very faint due to the large distances (Greenstein & Sargent 1974). The inherent difficulty in disentangling the latter population from the former was later noted (Philip et al. 1987); analyzing the stellar parameters and element abundances of faint blue stars at high Galactic latitudes is thus crucial to determining whether they are MS stars.
Young, blue early-type MS stars observed outside star-forming regions with different kinematical properties compared to typical early-type MS stars are known as runaway stars. They are expected to be formed in the Galactic disk and later ejected to the Galactic halo. Using recent Gaia Data Release 3 astrometric data, Carretero-Castrillo et al. (2023) estimated that ≈25% of O-type stars and ≈5% of Be-type stars are runaway stars. Two ejection mechanisms were proposed: ejection from a disrupted binary system and dynamical ejection due to stellar interactions in a dense environment (see Silva & Napiwotzki 2011). The binary ejection mechanism (BEM) was first proposed by Zwicky (1957) and later developed by Blaauw (1961). In this scenario, the more massive component of a close binary system undergoes a supernova (SN) explosion. Due to mass loss and/or the kick imparted to the newborn compact object, the two stars become gravitationally unbound. The secondary component has a high orbital velocity, which is mostly conserved after the binary is disrupted and becomes a runaway star. In its original form, this model predicts that runaway stars can appear only as single objects. From simulations, it is expected that the maximum ejection velocity is around 300 km s−1, or even up to 400 km s−1 (Portegies Zwart 2000).
The dynamical ejection mechanism (DEM) was proposed by Poveda et al. (1967) as an alternative to the BEM. In this scenario, runaway stars are ejected as a result of dynamical interactions due to gravitational instabilities during the early phases of an open cluster evolution. The dynamic interaction between the stars in the young cluster could result in the ejection of both single and multiple stars. Runaway stars ejected this way are expected to have a velocity of up to 400 km s−1 (Gvaramadze 2009); 2009MNRAS.396..570G.
After tracing the orbits of runaway stars back to their parent clusters, Hoogerwerf et al. (2001) speculated that both mechanisms are at work, contributing roughly equally to the population of runaway stars. This conclusion, however, was based on a very limited number of representative cases. In particular, the association of ζ Oph with a nearby pulsar as evidence of a BEM was later refuted by Neuhäuser et al. (2020), who show that the two objects do not have a common origin. While rejecting that specific association, Neuhäuser et al. (2020) propose a different pulsar as a possible counterpart to ζ Oph, which would preserve the interpretation of ζ Oph as a BEM and maintain the balance between the known DEM and BEM cases. While this conclusion was based on a very limited number of representative cases, it was supported by subsequent studies – for example, a study on the origin of B runaway stars, in which Liu et al. (2023) analyzed their chemical composition and kinematics – and undermines the assumption of equal contributions from the BEM and DEM. The bimodal distribution of ejection velocities observed in B-type stars suggests two distinct origins, aligning with the findings of Silva & Napiwotzki (2011). However, for runaway stars in the Small Magellanic Cloud, it was shown that the DEM dominates over the BEM by a factor of ∼2–3 (Oey et al. 2018); 2020ApJ...903...43D. This highlights the need to reevaluate the relative importance of these mechanisms using more robust statistical samples.
The predicted ejection velocity distributions are similar for the two mechanisms. Silva & Napiwotzki (2011) proposed that there are two different populations of runaway stars: a high-velocity population with a maximum ejection velocity of ∼(400 − 500) km s−1 and a low-velocity population with a maximum ejection velocity of ∼300 km s−1. These authors argue that the observed limit of ∼500 km s−1 and the bimodality of the observed distribution are natural consequences of the BEM. In addition, Silva & Napiwotzki (2011) found three stars that were inconsistent with an ejection from the Galactic disk, discussing different possible scenarios, including a possible formation in the Galactic halo.
The BEM and DEM may in fact act jointly, resulting in the so-called two-step ejection mechanism, which was proposed as a natural explanation for the presence of apparently isolated massive stars (Pflamm-Altenburg & Kroupa 2010). In this scenario, a binary system is first ejected via the DEM and, subsequently, one of the binary components is ejected via the BEM. This mechanism can produce runaway stars with no apparent link to a parent cluster, complicating efforts to trace them back to their origin and challenging the notion of truly in situ massive star formation. Although their past trajectories may not point to a birthplace, their unusually high velocities can still indicate an ejection origin. A further study by Gvaramadze et al. (2012) showed that most of the known O stars thought to have formed in isolation are very likely runaway stars. Also, it was demonstrated that the field population includes O stars whose low space velocities and/or young ages appear inconsistent with the large distances separating them from their potential birth clusters or with the ages of those clusters. These stars, likely ejected via the BEM, cannot be reliably traced back to their origins and may therefore be mistakenly classified as having formed in situ. In general, Gvaramadze et al. (2012) do not find compelling evidence supporting the in situ formation scenario for massive stars.
In addition, a recent study by Polak et al. (2024) suggests a possible third mechanism for the formation of runaway stars – the subcluster ejection scenario (SCES). In this model, a subset of stars from an infalling subcluster is ejected out of the cluster via a tidal interaction with the contracting gravitational potential of the assembling cluster. Stars ejected via SCES have similar velocities, directions, and ages, and their ejection directions tend to be anisotropic, often aligned with the subcluster mergers geometry. This could explain grouped runaway stars that appear to be coeval and moving in similar directions (Stoop et al. 2024).
During their evolution, runaway OB stars can undergo a core-collapse supernova (CCSN) explosion, likely resulting in the formation of a compact object – a neutron star (NS) or a black hole. It is important to study the possible spatial distribution of these explosions, as several supernova remnants (SNRs) were recently observed high above the Galactic plane (see, e.g., Fesen et al. 2015, Churazov et al. 2021), all listed in the new catalog by Green (2025). Thanks to the soft gamma repeater (SGR) detections from the extended Roentgen Survey with an Imaging Telescope Array all-sky survey, a new X-ray-selected SNR candidate was discovered high above the Galactic plane, SRGe J0023+3625/G116.6-26.1 (Churazov et al. 2021). It is hypothesized that this SNR originated from a Type Ia supernova (SN Ia). Objects with parameters similar to those of G116.6-26.1 are rare, but not to the extent of making the association with G116.6-26.1 implausible (Churazov et al. 2021). However, other interpretations are possible.
In addition, young isolated NSs are also observed high above the Galactic plane. The most well-known example is the source 1RXS J141256.0+792204, dubbed Calvera. It was first identified in the Roentgen Satellite All-Sky Survey Bright Source Catalog at Galactic latitude b = +37° (Rutledge et al. 2008). Calvera is located at a distance of ≈3.3 kpc and, given its Galactic coordinates, this corresponds to a height of ≈2 kpc above the Galactic plane (Mereghetti et al. 2021). Assuming that its characteristic age, τc = 285 kyr, is the true age (Halpern et al. 2013), it is possible to estimate the component of its velocity perpendicular to the Galactic plane. If the NS were born in the Galactic disk, its vt would be ≈6800 km s−1. This is unreasonably high compared to known kick velocities (Rigoselli et al. 2024). In addition, Calvera’s age is still uncertain. The proper motion measurements allowed Rigoselli et al. (2024) to estimate the age as < 10 kyr. The SNR G118.4+37.0 is associated with Calvera, suggesting that Calvera originated from the same SN. The estimated age of the SNR is also < 10 kyr (Arias et al. 2022; Araya 2023). There is a possibility that Calvera is a descendant of a runaway star (Posselt et al. 2008). Thus, modeling the population of runaway stars until they end in a SN event might shed light on the origin of Calvera and similar sources.
In this paper we present a statistical analysis of runaway OB stars and calculate the rate of their explosions as SNe. We modeled the distribution of SNRs produced by explosions of runaway OB stars relative to the Galactic plane, comparing it with that obtained by Bisht et al. (2024). These authors analyzed the possibility that the observed high-column-density absorption lines from a highly ionized gas can be explained by the reverse-shocked gas in non-radiative SNRs above the Galactic plane. Such SNRs should originate from runaway stars.
We also analyze the probability that Calvera originates from a runaway OB star. Finally, we compare the probabilities of finding a SNR formed after a CCSN explosion high above the Galactic plane and after a SN Ia following the method presented by Churazov et al. (2021).
The paper is organized as follows. In Sect. 2 we describe our assumptions and methods for modeling the population of runaway OB stars and tracking their motion in the Galactic potential. In Sect. 3 we present the spatial distribution of SNRs originating from the collapse of runaway OB stars, analyze the case of Calvera, and compare the distributions of CCSNe and SNe Ia high above the Galactic plane. Discussion and conclusions follow in Sects. 4 and 5.
2. Model
In this section we present the model used to calculate the spatial distribution of SN explosions of runaway OB stars. First, we present the parameters of OB stars and then describe how we calculated their trajectories in the Galactic potential.
2.1. Parameters of OB stars
There are four main ingredients of our model: the mass-dependent birth rate of OB stars, their initial spatial distribution, the velocity distribution, and, finally, the age at which a star is ejected due to binary disruption or to dynamical interaction.
2.1.1. Birth rate
The distribution of stellar masses in a given stellar population follows a statistical distribution known as the initial mass function (IMF), which is defined in terms of the number of stars per logarithmic mass interval, ξ(log M)=dN/dlog M. We adopted the Chabrier IMF for single stars in the Galactic disk (Chabrier 2003). The Chabrier IMF consists of a log-normal distribution at low stellar masses (M ≤ 1 M⊙),
![Mathematical equation: $$ \begin{aligned} \xi (\log M/M_\odot )_{M\le 1\,M_\odot } = A\exp \left[ -\dfrac{(\log (M/M_\odot ) - \log M_c)^2}{2\sigma ^2} \right] ,\end{aligned} $$](/articles/aa/full_html/2025/09/aa55186-25/aa55186-25-eq1.gif) (1)
(1)
and a power-law tail at higher masses (M > 1 M⊙),
 (2)
(2)
where  ,
,  ,
,  , B = 4.43 × 10⁻², x ≈ 1.3 ± 0.3. The parameters Mc, σ, and α are empirically determined based on observational data, mainly from stellar counts and luminosity functions in the solar neighborhood, while the constants A and B ensure continuity and proper normalization (see Chabrier 2003, for details)..
As we are interested in OB stars that undergo CCSN explosions, the range M/M⊙ < 1 can be ignored. Therefore, we proceeded with the inverse transfer sampling of an arbitrary number of stars from Eq. (2). Then, we selected only stars with M > 8 M⊙ as the less massive stars will not undergo a CCSN event (Smartt 2015).
After sampling Nstars stars in the mass range 8 M⊙ < M < 55 M⊙, we checked which of them qualify as runaway stars. As discussed, for example, in Carretero-Castrillo et al. (2023) the percentage of runaway stars depends on the spectral type, and the spectral type can be related to the mass (see Table 1; Weidner & Vink 2010; Nieva & Przybilla 2014). Here, we accepted the percentage of runaway B stars to be the same as that one of Be stars, as this is in agreement with the general assumption that 5-10% of B stars are runaway stars and close to the value of 4% proposed by Stone (1991).
Percentage of runaway stars as a function of the spectral types and masses.
For each bin, the central mass value is determined and the corresponding mass percentage is assigned to it. Then, linear interpolation is applied to obtain a continuous trend. Based on the probability obtained from the interpolation, for each star it is checked whether it is a runaway, obtaining the number of runaway stars (Nrunaway). Due to interpolation, the upper limit of the mass in our subset of runaway stars is 55 M⊙. However, the results are not sensitive to this as the number of massive stars becomes lower and lower at higher masses.
2.1.2. Initial spatial distribution
We assumed that the initial spatial distribution of runaway OB stars has cylindrical symmetry, i.e., it is independent of the presence of arms and other spatial features of the Galaxy but depends only on the radial distance from the Galactic center, R, and the height above the Galactic plane, z. We also assumed that the distribution of OB stars is similar to the distribution of young radio pulsars, which is well traced in a relatively large volume of the Galaxy. Then the initial spatial density of OB stars is (Lorimer et al. 2006); 2016PhRvD..93a3009A
 (3)
(3)
here R⊙ = 8.2 kpc is the distance of the Sun from the Galactic center and h = 0.181 kpc is the vertical height scale. The coefficients α and β are taken to be α = 1.93, β = 5.06 (Lorimer et al. 2006); 2016PhRvD..93a3009A. We proceeded with the rejection sampling of R and the inverse transform sampling of z for each runaway star from Eq. (3). The azimuthal angle, φ, was randomly sampled, reflecting the assumed axisymmetry of the distribution.
2.1.3. Velocity distribution
We assumed that before the ejection (acceleration), a star has the typical velocity of a massive MS star in the Galactic disk. Then, at some age (see Sect. 2.1.4) its velocity increases either because of a dynamic interaction or because of a binary disruption. Thus, we have to specify two velocity distributions: before and after ejection.
The velocity components of newborn MS stars follow a normal distribution. Dispersions along the three axes of the velocity ellipsoid reflect random motions added to the general Galactic rotation. The velocity dispersion of OB stars in the Galactic coordinate system is characterized by the three principal velocity dispersions (Bobylev et al. 2022),
 (4)
(4)
that are not aligned with the Galactic coordinate axes (U, V, W) but are instead rotated by specific angles:
 (5)
(5)
Each pair of L and B represents the direction of a principal axis in the Galactic coordinates. Since the velocity ellipsoid is tilted relative to the (U, V, W) system, we needed to apply a rotational transformation to express the velocity components in the Galactic velocity coordinates. To transform from the principal velocity frame to the Galactic velocity frame (U, V, W), we used the rotation matrix (R) and the unit vectors of the principal axes:
 (6)
(6)
The velocity dispersion tensor in the principal axes frame ΣV is given by
 (7)
(7)
which becomes in the Galactic velocity frame (U, V, W)
 (8)
(8)
The initial random velocity components are sampled from the normal distribution with the given covariance matrix ΣUVW employing GALPY (Bovy 2015). The circular velocity, dependent on R and z and also calculated employing GALPY, is added to the initial random velocity.
At the moment of ejection, the velocity is instantly increased. As discussed in Silva & Napiwotzki (2011), the distribution of the (scalar) ejection velocity of runaway stars is bimodal with a maximum value of 400 − 500 km s−1. This bimodality can be a natural consequence of the BEM. However, since the difference between the two components is small, it can be assumed that the distribution of the scalar ejection velocity is described by a single Maxwellian that peaks at 156 km s−1 (Silva & Napiwotzki 2011). Ejection velocities are sampled from the Maxwellian distribution assuming isotropy, i.e., the direction is randomly drawn from a uniform distribution over the sphere, and the resulting velocity components are added to the one mentioned previously.
2.1.4. Ages
The ejection time depends on the mechanism responsible for the ejection. Following previous studies (Oey et al. 2018); 2020ApJ...903...43D, we assumed that two-thirds of the runaway stars are ejected by the DEM and one-third by the BEM. As shown by Fujii & Portegies Zwart (2011), most Galactic runaway OB stars originate from star clusters that experience core collapse within the first 1 Myr of their existence. Therefore, we assumed that two-thirds of the runaway stars are ejected 1 Myr after birth.
To determine the ejection time of a runaway star ejected via the BEM, we first selected the mass of its binary companion and then computed its lifetime, which corresponds to the ejection time of the secondary star due to binary disruption produced by the SN explosion of the primary. The distribution of the mass ratio q = M2/M1 (with M2 < M1) in binary stars is given by (Sana et al. 2012)
 (9)
(9)
Following common practice, f(q) is approximated as a constant (Kinugawa et al. 2024), meaning that the distribution is flat, so the initial masses of the primary and secondary components are independent of each other. First, we randomly found the primary component for every runaway star ejected via the BEM, following the IMF given by Eq. (2). Then, the lifetime of the primary component was calculated, and this corresponds to the time of ejection of the runaway star. Also, the lifetimes of all the runaway stars are calculated, which sets the time when they undergo a SN explosion. Lifetimes for both the primary components and runaway stars are calculated by linear interpolation from the evolutionary track for metallicity Z = 0.01 given in the PARSEC database1 (Costa et al. 2025).
2.2. Trajectories in the Galactic potential
Following the procedure explained in Sect. 2.1, we obtain the masses, initial spatial distribution, velocity distribution from birth to ejection, velocity distribution after ejection, time of ejection depending on the ejection mechanism, and lifetime of runaway stars. After these parameters are set, the trajectories in the Galactic potential can be calculated. To do so, we used the MWPOTENTIAL2014 from the GALPY library (Bovy 2015).
MWPOTENTIAL2014 is a realistic description of the MW on small and large scales defined as:
-
The disk is modeled following the Miyamoto-Nagai approach (MIYAMOTONAGAIPOTENTIAL).
-
The bulge is modeled with a power-law density profile that is exponentially cut-off with a power-law exponent of −1.8 and a cut-off radius of 1.9 kpc (POWERSPHERICALPOTENTIALCUTOFF).
-
The dark-matter halo is modeled following the Navarro–Frenk–White potential (NFWPOTENTIAL).
After integration, the spatial distribution of runaway OB stars in the Galaxy at the moment of SN explosion is obtained.
3. Results
3.1. OB stars
In our sample, we used Nstars ≈ 60 000 stars with masses 8 < M/M⊙ < 55 and Nrunaway ≈ 7000 of them are runaway stars. In Fig. 1, the initial and final distributions in the R-z plane of the runaway stars are shown. It can be seen that, at the initial time, the stars are concentrated toward the Galactic disk, whereas at the time of the explosion, the dispersion around the Galactic plane is greater, and the stars can end up high above the Galactic plane, in the thick disk and in the Galactic halo.
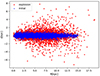 |
Fig. 1. Initial (blue dots) and final (red crosses) distribution of the runaway stars in the R-z plane, where R corresponds to the Galactocentric radial distance and z to the height above the Galactic plane. |
In Fig. 2 we present the cumulative distribution function (CDF) of the absolute value of the height above the Galactic plane |z| at the moment of the SN explosion. Our model predicts that around 85% of the runaway stars will explode below 1 kpc, and 95% at |z|≲1.9 kpc, suggesting that a non-negligible fraction of runaway OB stars can explode in the Galactic halo.
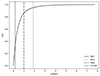 |
Fig. 2. Final CDF of the height above the Galactic plane, |z| (solid line). The vertical lines mark the scale height of the initial distribution (dashed line), 1 kpc (dash-dotted line), and the value of z below which 95% of runaway stars are concentrated (dotted line). |
The final distribution is calculated using a large number of runaway stars, on the order of 103, to ensure statistically significant results. In order to estimate the real number of SNRs coming from runaway OB stars in the Galaxy, we followed two approaches, one based on the star formation rate (SFR) and the other on the CCSN rate.
First, we calculated the weighted fraction of runaway stars:
 (10)
(10)
where p(M) is the fraction of runaway stars obtained by linear interpolation of the values reported in Table 1.
The SFR in our Galaxy is SFR = 2.0 ± 0.7 M⊙ yr−1 (Elia et al. 2022). The total number of stars with 0.08 < M/M⊙ < 150 (Ntotal) formed in the Galaxy during time t (e.g., the average lifetime of a SNR) is
 (11)
(11)
where < M> is the average stellar mass, calculated using the Chabrier IMF (Eqs. (1) and (2)):
 (12)
(12)
The number of existing SNRs originating from runaway OB stars is then given by
 (13)
(13)
where the ratio NOB/Ntotal can be found integrating Eqs. (1) and (2).
On the other hand, the CCSN rate in our galaxy is estimated to be CCSN = 1.9 ± 1.1 century−1 (Diehl et al. 2006). The number of potentially observable SNRs originating from runaway OB stars, NCCSN, was obtained by multiplying the CCSN rate by the characteristic time and by the fraction of runaway stars:
 (14)
(14)
Using Eq. (10), we calculate p = 0.11 and considering the typical lifetime of SNRs as t = 100 kyr, we find that the number of SNRs originating from runaway OB stars is around 310 when using the SFR and around 210 when using the CCSN rate. The two values are consistent within the uncertainties (based on errors in the CCSN rate, 1.9 ± 1.1 century−1, and the SFR, 2.0 ± 0.7 M⊙ yr−1).
3.2. Calvera
As mentioned above, Calvera is a young NS with a characteristic age of τc = 285 kyr (Halpern et al. 2013). It is suspected that Calvera originated from an OB runaway star (Posselt et al. 2008). Here, we want to estimate the probability that a runaway OB star went SN in a Galactic region characterized by Calvera’s location.
Calvera is located at a distance of ≈3.3 kpc and at a height above the Galactic plane of ≈2 kpc (Rutledge et al. 2008). Therefore, by fixing the values of  and
and  , we find the probability density of a SN explosion in the cylinder with radius
  and
and  . Then, to obtain the probability, we multiplied the probability density by the number of SN explosions coming from runaway OB stars NSFR and NCCSN, obtained from Eqs. (13) and (14), using t = τc.
We obtain 0.7 − 1.3 using the SFR and 0.5 − 0.9 using the CCSN rate. This suggests that there should be ∼1 object within the cylinder originating from runaway OB star SN explosions in 285 kyr, supporting the idea that Calvera could have originated from a runaway OB star.
On the other hand, it was recently proposed that Calvera was created in the core-collapse following a SN explosion < 10 kyr ago (Rigoselli et al. 2024). Again, using Eq. (13), Eq. (14) and the upper limit of t = 10 kyr, we obtain 0.02 − 0.05 and 0.02 − 0.03 objects originating from the SN explosion of runaway OB stars in the cylinder in 10 kyr. Even in this case, the probability that Calvera originated from the SN explosion of a runaway star is not negligible.
The inverse transform sampling procedure introduces inherent statistical fluctuations between runs. Consequently, we report a range of values rather than a single deterministic outcome to account for this variability.
3.3. SNRs
In this subsection we compare the probability of finding a SNR high above the Galactic plane originating from SN Ia (see Churazov et al. 2021, Sect. 3.6) or CCSN explosions of runaway OB stars. As explained in Churazov et al. (2021), to obtain the number of SNRs originating from SN Ia explosions at |z|≥1 kpc, it is necessary to analyze the rate of SNe Ia in the thick disk and the halo. As the Galaxy halo has a stellar mass of ∼1.4 × 10⁹ M⊙ and a thick disk of 6 × 10⁹ M⊙ (Deason et al. 2019), and adopting the observational estimate of the SN Ia rate for elliptical galaxies with stellar mass < 1011 M⊙ of ∼0.09 SNe Ia per 100 yr per 1010 M⊙ (Li et al. 2011), the SN Ia rate of the Galaxy is ∼5.4 × 10⁻⁴ per year in the thick disk and ∼1.3 × 10⁻⁴ per year in the halo. To have the same proportionality and statistically significant results, we sampled 5400 objects from the thick disk and 1300 objects from the halo.
The spatial density distribution of the objects sampled from the thick disk (ρD) follows the exponential law
 (15)
(15)
where hR = 2.1 kpc and hz = 0.9 kpc are radial vertical and height scales (Bland-Hawthorn & Gerhard 2016). The spatial density distribution of the objects sampled from the halo (ρH) underlay the spheroidal distribution along the galactocentric distance and a broken power law:
 (16)
(16)
where R and z are in kpc, p = 2.3 for R ≤ 27 kpc, and p = 4.6 for R ≥ 27 kpc (Deason et al. 2011).
After sampling SNRs originating from a SN Ia explosion, we seek to compare the dominance of Type Ia and CC SNRs as a function of Galactic height, identifying the regions where each type prevails. As the total SN Ia rate for |z|≥1 kpc is ∼5.4 × 10⁻⁴ + 1.3 × 10−4 = 6.7 × 10⁻⁴ SN Ia per year, and the CCSN rate is 1.9 × 10⁻² per year, we see that there are around 28 times more SNRs originating from CCSN than from SN Ia explosions.
Therefore, we plotted the CDFs for SNRs originating from CCSNe and SNe Ia depending on the height above the Galactic plane, where the CCSN one is normalized to 28 (Fig. 3). It is important to note that the part of the figure for |z|< 1 kpc is not relevant, as no SN Ia in the thin disk was included in this calculation. In all z, the SNRs of the CCSNe are dominant over those originating from SNe Ia.
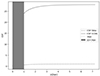 |
Fig. 3. CDF of the absolute value of the height above the Galactic plane, |z|, for SNRs originating from CCSNe (solid line) and SNe Ia (dashed line). The vertical dotted line is at 1 kpc. The CDF of SNRs originating from CCSNe is normalized to 28, as the rate of CCSNe is 28 times higher than that of SNe Ia. As SNe Ia from the thin disk are excluded from this calculation, only the difference for |z|≥1 kpc should be observed. |
4. Discussion
4.1. OB stars
Bisht et al. (2024) explored the possibility that the strong absorption lines from highly ionized gas can be explained if the line of sight passes through the reverse shocked material in a non-radiative SNR located outside the Galactic plane of the MW. In connection with this, the authors modeled the distribution of SNRs related to runaway OB stars. It is therefore of interest to compare the results of the two approaches.
The results obtained in Sect. 3.1 are slightly different from those presented in Bisht et al. (2024). These authors have shown that around 93% of the SN explosions of runaway stars are confined within |z|≤1 kpc, and almost all are within |z|≤2 kpc. In our model around 85% are within |z|≤1 kpc and around 95% within |z|≲1.9 kpc. Unlike Bisht et al. (2024), who used the uniformly distributed lifetime of runaway stars between 1 and 10 Myr and the assumption that stars are ejected at birth, our approach of sampling stars from the IMF and calculating their lifetime based on masses from evolutionary tracks published in the PARSEC database allows for a more precise characterization of the final distribution of the SN explosion originating from runaway OB stars. We relied on simulation results for greater accuracy since the approximate mass–lifetime relation (Carroll & Ostlie 2017),
 (17)
(17)
underestimates the lifetime of massive stars. Moreover, we followed the motion before the ejection and determined the moment of ejection, which provides further improvements. In our model, around 40% of runaway stars are ejected more than 10 Myr before they explode. As a result, stars can continue to move longer at their ejection velocities, which naturally explains their presence at larger |z|.
Another key distinction is that we assumed that the initial spatial distribution of OB stars follows that of young pulsars, whereas in Bisht et al. (2024) the initial radial coordinate of the birthplace was assumed to follow the stellar mass distribution. Our choice is motivated by the fact that the initial distribution of radio pulsars better traces the distribution of the progenitors in the last ≲10 Myr. Another possibility is to assume that the distribution of OB stars follows that of SNRs, having the same form as Eq. (3), but with different coefficients α and β (Case & Bhattacharya 1998). However, we believe that pulsars provide a better tracer because of their larger number of known objects and the more accurate distance determinations. Still, it is important to note that this model does not account for the spiral structure of the Galaxy and could be refined with a more detailed model of the distribution of young massive stars. Despite this, the primary aim of this work is to investigate the distribution of CCSNe, which predominantly occur at intermediate galactocentric distances, and to explore a possible origin scenario for Calvera, which is relatively nearby. The model is not accurate in the central few kiloparsecs or in the outer regions beyond ∼12 kpc. Given that fewer than 5% of the stars in our initial distribution lie beyond 12 kpc, this limitation has a minimal impact on the overall results. The results within the central few kiloparsecs should be interpreted with caution, as the model does not adequately capture the complexity of this region.
Our model could be upgraded using the bimodal velocity distribution and Eq. (9) instead of the approximation of constant q, but since these differences are tiny and due to our statistical approach, this would not result in significant differences. As mentioned before, the bimodality of the observed distribution is natural consequences of the BEM and we used the assumption that one third of stars are ejected via the BEM, and the remaining ones by the DEM. This assumption relies on the analyses of runaway stars in the Small Magellanic Cloud (Oey et al. 2018); 2020ApJ...903...43D, and is in agreement with the results for the Galaxy (Renzo et al. 2019). As shown in Renzo et al. (2019), the BEM contributes to the population of unbound massive stars, and it predominantly produces walkaway stars rather than high-velocity runaways. Renzo et al. (2019) suggest a runaway fraction among stars more massive than 15 M⊙ between 0.2% and 2.6%, and velocities mainly ≲60 kms−1. This is in contrast to the DEM, which is more efficient at producing high-speed runaway stars. In addition, they found that the runaway fraction and velocity depend on the metallicity, with five times more runaway stars with masses higher than 7.5 M⊙ for lower metallicities. Still, assuming that approximately 11% of all OB stars are runaway stars (as it follows from Eq. (10)), and that one third of these are produced by the BEM, implies that about 3.7% of all OB stars become runaway stars via the BEM. This estimate is close to the values suggested by Renzo et al. (2019), who found that only ∼0.5% of stars with M ≳ 15 M⊙ become high-velocity runaways via the BEM, and around 5 times more when M ≳ 7.5 M⊙. Although these two works support the dominance of the DEM for runaway OB stars, other studies, such as Sana et al. (2022), suggest that the BEM plays a significant role in certain cases, challenging a unified explanation. In addition, we did not account for the two-step ejection mechanism (Pflamm-Altenburg & Kroupa 2010), nor for the SCES (Polak et al. 2024), as the first one might be a relatively rare process and the role and properties of the second one are not yet well understood. Therefore, further investigation of the ejection mechanisms, including their contribution to the total number of ejected stars and the velocities they impart, could provide valuable input for improving this model.
Furthermore, our upper mass limit of a runaway star is 55 M⊙, due to interpolation, but we do not expect the final result to be sensitive to the upper mass limit, as more massive stars are rare and have a short lifetime, making it unlikely that they move to high |z| considering the ejection velocity distribution. Also, the upper mass limit for a star to explode in a CCSN is still an open question, and recent studies, such as Janka (2012), Davies & Beasor (2018), and Schady et al. (2019), suggest a value between 20 and 40 M⊙. Still, the upper limit is highly dependent on the metallicity and, as discussed in Heger et al. (2003), stars with higher metallicity could experience CCSNe even when their initial masses are > 40 M⊙. For these reasons, we think that our choice of 55 M⊙ as the upper limit is reasonable. The final statistics are definitely more sensitive to the lower limit on the mass, which is set at 8 M⊙ in our study. This depends on both the metallicity and evolution. According to the simulations by Ibeling & Heger (2013), the minimum mass is ∼8.3 M⊙, which is very close to the value we used.
The percentage of runaway OB stars as a function of spectral type and mass, presented in Table 1, is obtained by linear interpolation. This approach may introduce some uncertainties, but, due to the limited number of bins, alternative interpolation methods are not suitable in this case.
4.2. Calvera and SNRs
Our model predicts that, considering the characteristic age of Calvera as its true age, there is a high probability that the progenitor was a runaway star. Therefore, Calvera could be explained in our model. However, there can be at most a few other NSs high above the Galactic plane with ages of more than a few hundred thousand years at comparable distances or closer.
In a recent study (Rigoselli et al. 2024), the kinematic age of Calvera was determined to be < 10 kyr. This is in correspondence with the age of the SNR G118.4+37.0, possibly related to Calvera (Arias et al. 2022; Araya 2023). In this case, the probability that Calvera originated from a runaway OB star is significantly lower but not negligible, about a few percent.
The results presented above in Sect. 3.2 demonstrate that the probability that Calvera originated from a runaway star is greater for larger ages of the NS. Although the true age of Calvera is expected to be lower than the characteristic age, it could not be as low as the kinematic age and the age of the associated SNR G118.4+37.0. As argued in Rigoselli et al. (2024), the kinematic age of Calvera could be affected by the uncertainties of the distance determined from its thermal X-ray emission (Mereghetti et al. 2021). However, the age of the associated SNR, as discussed in Arias et al. (2022), could be a poor estimate if the Sedov-Taylor self-similar solution is not appropriate, which is possible for SNRs expanding in a low-density medium such as that in the Galactic halo. Furthermore, as stated in Araya (2023), the age of the SNR was determined using the distance obtained for Calvera (Mereghetti et al. 2021), which could add more uncertainties to the final result. Future improved age estimates of Calvera and of SNR G118.4+37.0 could lead to a more accurate and robust interpretation of our results.
Finally, our model predicts (see Sect. 3.3) that the SNRs observed at high Galactic latitudes could be explained better in terms of SN explosions of runaway OB stars than of SNe Ia. Since the velocity of runaway stars is limited to ≈500 kms−1 and the lifetime to ≈50 Myr, they cannot explode above |z|≈25 kpc. Therefore, at very large |z|, only SNRs originating from SNe Ia could occur. This is important for the interpretation of the recently observed SNRs, for example those presented by Fesen et al. (2015) and Churazov et al. (2021). As shown in Green (2025), during the last few years, SNRs have been discovered at unexpectedly high latitudes. Considering the results that we present in Sect. 3.1, there could be more of them. However, at this moment, all the SNRs with a determined distance, and therefore known z, presented in the catalog by Green (2025) are at |z|< 1 kpc. New surveys for high-latitude SNRs are desirable.
A similar comparative approach was taken by Murphey et al. (2021), who examined the distributions of the CCSNe and SNe Ia distributions in the context of Galactic SNRs. However, their analysis was performed by static sampling of CCSNe in a thin disk and SNe Ia in a thin and thick disk, mostly corresponding to |z|≲1 kpc. Despite the common goal of contrasting the two types of SNe, the scope and spatial domains of the two studies differ significantly. Our analysis emphasizes high-latitude regions, while theirs is restricted to |b|≲15°. These differences naturally lead to different interpretations and observational constraints. Complementing these Galactic studies, Hakobyan et al. (2017) used observational data from a sample of 102 SNe in highly inclined spiral galaxies to study the vertical distribution of SN types. They found that CCSNe are strongly confined to the thin disk, while SNe Ia show a significantly broader vertical distribution. While Hakobyan et al. (2017) provide valuable observational constraints on the vertical distributions of SNe in external galaxies, their results cannot be directly compared with ours, as our analysis focuses specifically on runaway CCSNe and SNe Ia outside the thin disk.
The number of SN explosions originating from runaway OB stars presented in Sect. 3.1, as well as the probability of finding an object like Calvera discussed in Sect. 3.2, depend mainly on the choice of IMF, the SFR and CCSN rate (see Eqs. (13) and (14)). The calculation was performed using both the Chabrier IMF and other formulations, such as the Miller-Scalo (Miller & Scalo 1979) and Kroupa IMFs (Kroupa 2002). The results presented in Sect. 3.1 show only minor variations when obtained using the Kroupa IMF. Such behavior is expected, as they have a similar power-law slope for 8 < M/M⊙ < 55. When using the Miller-Scalo IMF, 95% of stars will explode at |z|≲2.5 kpc, while the value of |z|≲1.9 kpc is obtained using both the Kroupa and Chabrier IMF. This difference can be attributed to the steeper slope of the Miller-Scalo IMF, which leads to fewer massive stars being sampled. Consequently, a larger fraction of lower-mass stars, characterized by longer lifetimes, are selected, allowing them more time to travel and potentially reach greater vertical distances (|z|) than those produced using the Kroupa or Chabrier IMFs.
Also, the number of SN explosions in t = 100 kyr originating from runaway OB stars and the probability of finding an object like Calvera depend on the choice of the IMF (Sects. 3.1 and 3.2). When using Kroupa IMF, the number of SNRs in t = 100 kyr originating from runaway OB stars is around 190 when using SFR and around 210 when using the CCSN rate. In both cases, the number of Calvera-like objects is between 0.4 and 0.8, again suggesting that there could be a ∼1 object within the cylinder originating from runaway OB star SN explosions in 285 kyr. Using t = 10 kyr, we obtain 0.01–0.02 objects originating from the SN explosion of runaway OB stars in the cylinder in 10 kyr. On the other hand, when adopting the Miller-Scalo IMF, the number of SNRs originating from runaway OB stars is around 110 when using the SFR and around 160 when using the CCSN rate. Therefore, the probability based on SFR is 0.4 - 0.9, while the CCSN-based estimate is 0.6–1.4, again suggesting that there could be a ∼1 object within the cylinder originating from runaway OB star SN explosions in 285 kyr. Using t = 10 kyr, we obtain 0.01–0.03 (SFR) and 0.02–0.05 (CCSN rate) objects originating from the SN explosion of runaway OB stars in the cylinder in 10 kyr. Here we can see that, even though the final results depend on the choice of the IMF, the differences are tiny.
The value we used for SFR is based on data from the Herschel Infrared Galactic Plane Survey (Elia et al. 2022). The presented value of SFR is in agreement with all previous studies, except one (see Elia et al. 2022, Table 1). The CCSN rate, adopted from Diehl et al. (2006), is estimated by analyzing gamma rays from radioactive 26Al, which is in agreement with other studies (e.g., Cappellaro et al. 1993; Reed 2005; Rozwadowska et al. 2021). However, recently lower estimates of the Galactic SFR and the corresponding CCSN rate have been proposed.
In the recent study by Quintana et al. (2025), the Galactic SFR and CCSN rate are derived from the census of OB stars within 1 kpc of the Sun. The value of Galactic SFR,  , is in agreement with that presented in Robitaille & Whitney (2010), but is significantly lower compared to many earlier studies (see Elia et al. 2022, Table 1). The authors relate this difference to a more complete OB star catalog that they use. In addition, the estimated value of the Galactic CCSN rate, CCSN = 0.4 ± 0.1 century−1 (with an upper mass limit on CCSN progenitors) and CCSN = 0.5 ± 0.1 century−1 (without an upper mass limit on CCSN progenitors), is lower than the previous estimates, for example Cappellaro et al. (1993), Reed (2005), Diehl et al. (2006), Rozwadowska et al. (2021). As claimed in this work, the values are significantly lower primarily because of the smaller size of the OB catalog combined with improved stellar evolutionary models.
Using the values of the SFR and CCSN rate without an upper mass limit on CCSN progenitors (Quintana et al. 2025) in Eqs. (13) and (14) and the Chabrier IMF, we find that the number of SNRs originating from runaway OB stars is around 100 (SFR) and around 45 (CCSN rate). Naturally, these results are significantly lower than those presented in Sect. 3.1. In the case of Calvera, using its characteristic age, we expect 0.2 − 0.4 (SFR) and 0.2 − 0.3 (CCSN rate) of such objects in the volume considered, and using its kinematic age, we expect only 0.007 − 0.014 (SFR) and 0.007 − 0.010 (CCSN rate). In this case, the probability that Calvera originated from a runaway OB star is very low. This brings us back to the uncertainties mentioned previously in age estimates.
5. Conclusions
We have analyzed the spatial distribution and rate of runaway OB stars relative to the Galactic plane, and the key conclusions are summarized below.
-
Around 85% of runaway OB stars will explode within |z|≤1 kpc and around 95% within |z|≲1.9 kpc. This suggests that a significant fraction of runaway OB stars undergo SN explosions in the Galactic halo.
-
We expect to have around 310 SNRs (using the SFR) and around 210 SNRs (using the CCSN rate) with ages of < 105 yr originating from runaway OB stars. These numbers depend mainly on the SFR and CCSN rate. Considering the latest lower estimates, we expect to have around 100 SNRs (using the SFR) and around 45 SNRs (using the CCSN rate) younger than 105 yr.
-
We may be able to explain the young NS Calvera using our model, and the probability of doing so is greater for a larger age of Calvera. These results depend on both the SFR and the CCSN rate, as well as on the estimated ages of Calvera and the associated SNR, G118.4+37.0.
-
We have compared the probabilities of finding a SNR originating from a CCSN high above the Galactic plane with those originating from SNe Ia. More SNRs originate from CCSNe than from SNe Ia. However, since runaway stars have limited velocities, CCSN cannot explode at very large distances from the Galactic plane. Therefore, at extreme heights, only SNRs originating from SNe Ia are expected.
These results support the hypothesis that Calvera originates from a runaway OB star and are important for further analysis of the SNRs recently observed high above the Galactic plane. Future investigations into the age of Calvera and the associated SNR G118.4+37.0, as well as refinements to the Galactic SFR and the Galactic CCSN rate, are essential for accurately interpreting our results. Finally, new surveys are needed for high-latitude SNRs to validate our predicted numbers and distribution.
Acknowledgments
The authors thank the referee for useful comments and suggestions. This work is based on a thesis submitted by VD in partial fulfillment of an MSc degree in Astrophysics and Cosmology at the University of Padova.
References
- Ahlers, M., Bai, Y., Barger, V., & Lu, R. 2016, Phys. Rev. D, 93, 013009 [CrossRef] [Google Scholar]
- Araya, M. 2023, MNRAS, 518, 4132 [Google Scholar]
- Arias, M., Botteon, A., Bassa, C. G., et al. 2022, A&A, 667, A71 [NASA ADS] [CrossRef] [EDP Sciences] [Google Scholar]
- Bisht, M. S., Banerjee, P., Nath, B. B., & Shchekinov, Y. 2024, ApJ, 975, 26 [Google Scholar]
- Blaauw, A. 1961, Bull. Astron. Inst. Netherlands, 15, 265 [NASA ADS] [Google Scholar]
- Bland-Hawthorn, J., & Gerhard, O. 2016, ARA&A, 54, 529 [Google Scholar]
- Bobylev, V. V., Bajkova, A. T., & Karelin, G. M. 2022, Astron. Lett., 48, 243 [NASA ADS] [CrossRef] [Google Scholar]
- Bovy, J. 2015, ApJS, 216, 29 [NASA ADS] [CrossRef] [Google Scholar]
- Cappellaro, E., Turatto, M., Benetti, S., et al. 1993, A&A, 273, 383 [NASA ADS] [Google Scholar]
- Carretero-Castrillo, M., Ribó, M., & Paredes, J. M. 2023, A&A, 679, A109 [NASA ADS] [CrossRef] [EDP Sciences] [Google Scholar]
- Carroll, B. W., & Ostlie, D. A. 2017, An Introduction to Modern Astrophysics, Second Edition (Cambridge, United Kingdom: Cambridge University Press) [Google Scholar]
- Case, G. L., & Bhattacharya, D. 1998, ApJ, 504, 761 [NASA ADS] [CrossRef] [Google Scholar]
- Chabrier, G. 2003, PASP, 115, 763 [Google Scholar]
- Churazov, E. M., Khabibullin, I. I., Bykov, A. M., et al. 2021, MNRAS, 507, 971 [NASA ADS] [CrossRef] [Google Scholar]
- Costa, G., Shepherd, K. G., Bressan, A., et al. 2025, A&A, 694, A193 [NASA ADS] [CrossRef] [EDP Sciences] [Google Scholar]
- Davies, B., & Beasor, E. R. 2018, MNRAS, 474, 2116 [NASA ADS] [CrossRef] [Google Scholar]
- Deason, A. J., Belokurov, V., & Evans, N. W. 2011, MNRAS, 416, 2903 [NASA ADS] [CrossRef] [Google Scholar]
- Deason, A. J., Belokurov, V., & Sanders, J. L. 2019, MNRAS, 490, 3426 [NASA ADS] [CrossRef] [Google Scholar]
- Diehl, R., Halloin, H., Kretschmer, K., et al. 2006, Nature, 439, 45 [CrossRef] [PubMed] [Google Scholar]
- Dorigo Jones, J., Oey, M. S., Paggeot, K., Castro, N., & Moe, M. 2020, ApJ, 903, 43 [NASA ADS] [CrossRef] [Google Scholar]
- Elia, D., Molinari, S., Schisano, E., et al. 2022, ApJ, 941, 162 [NASA ADS] [CrossRef] [Google Scholar]
- Fesen, R. A., Neustadt, J. M. M., Black, C. S., & Koeppel, A. H. D. 2015, ApJ, 812, 37 [NASA ADS] [CrossRef] [Google Scholar]
- Fujii, M. S., & Portegies Zwart, S. 2011, Science, 334, 1380 [Google Scholar]
- Green, D. A. 2025, J. Astrophys. Astron., 46, 14 [Google Scholar]
- Greenstein, J. L., & Sargent, A. I. 1974, ApJS, 28, 157 [Google Scholar]
- Gvaramadze, V. V. 2009, MNRAS, 395, L85 [NASA ADS] [Google Scholar]
- Gvaramadze, V. V., Gualandris, A., & Portegies Zwart, S. 2009, MNRAS, 396, 570 [Google Scholar]
- Gvaramadze, V. V., Weidner, C., Kroupa, P., & Pflamm-Altenburg, J. 2012, MNRAS, 424, 3037 [NASA ADS] [CrossRef] [Google Scholar]
- Hakobyan, A. A., Barkhudaryan, L. V., Karapetyan, A. G., et al. 2017, MNRAS, 471, 1390 [NASA ADS] [CrossRef] [Google Scholar]
- Halpern, J. P., Bogdanov, S., & Gotthelf, E. V. 2013, ApJ, 778, 120 [NASA ADS] [CrossRef] [Google Scholar]
- Heger, A., Fryer, C. L., Woosley, S. E., Langer, N., & Hartmann, D. H. 2003, ApJ, 591, 288 [CrossRef] [Google Scholar]
- Hoogerwerf, R., de Bruijne, J. H. J., & de Zeeuw, P. T. 2001, A&A, 365, 49 [NASA ADS] [CrossRef] [EDP Sciences] [Google Scholar]
- Humason, M. L., & Zwicky, F. 1947, ApJ, 105, 85 [NASA ADS] [CrossRef] [Google Scholar]
- Ibeling, D., & Heger, A. 2013, ApJ, 765, L43 [NASA ADS] [CrossRef] [Google Scholar]
- Janka, H.-T. 2012, Ann. Rev. Nucl. Part. Sci., 62, 407 [Google Scholar]
- Kinugawa, T., Horiuchi, S., Takiwaki, T., & Kotake, K. 2024, MNRAS, 532, 3926 [NASA ADS] [CrossRef] [Google Scholar]
- Kroupa, P. 2002, Science, 295, 82 [Google Scholar]
- Li, W., Chornock, R., Leaman, J., et al. 2011, MNRAS, 412, 1473 [NASA ADS] [CrossRef] [Google Scholar]
- Liu, Z., Cui, W., Zhao, G., et al. 2023, MNRAS, 519, 995 [Google Scholar]
- Lorimer, D. R., Faulkner, A. J., Lyne, A. G., et al. 2006, MNRAS, 372, 777 [NASA ADS] [CrossRef] [Google Scholar]
- Mereghetti, S., Rigoselli, M., Taverna, R., et al. 2021, ApJ, 922, 253 [NASA ADS] [CrossRef] [Google Scholar]
- Miller, G. E., & Scalo, J. M. 1979, ApJS, 41, 513 [Google Scholar]
- Murphey, C. T., Hogan, J. W., Fields, B. D., & Narayan, G. 2021, MNRAS, 507, 927 [CrossRef] [Google Scholar]
- Neuhäuser, R., Gießler, F., & Hambaryan, V. V. 2020, MNRAS, 498, 899 [CrossRef] [Google Scholar]
- Nieva, M.-F., & Przybilla, N. 2014, A&A, 566, A7 [NASA ADS] [CrossRef] [EDP Sciences] [Google Scholar]
- Oey, M. S., Dorigo Jones, J., Castro, N., et al. 2018, ApJ, 867, L8 [NASA ADS] [CrossRef] [Google Scholar]
- Pflamm-Altenburg, J., & Kroupa, P. 2010, MNRAS, 404, 1564 [NASA ADS] [Google Scholar]
- Philip, A. G. D., Hayes, D. S., & Liebert, J. W. 1987, The Second Conference on Faint Blue Stars. Proceedings of the International Astronomical Union Colloquium No. 95, held in Tucson, Arizona, 1–5 June, 1987 (Schenectady, New York: L. Davis Press) [Google Scholar]
- Polak, B., Mac Low, M.-M., Klessen, R. S., et al. 2024, A&A, 690, A207 [NASA ADS] [CrossRef] [EDP Sciences] [Google Scholar]
- Portegies Zwart, S. F. 2000, ApJ, 544, 437 [NASA ADS] [CrossRef] [Google Scholar]
- Posselt, B., Popov, S. B., Haberl, F., et al. 2008, A&A, 482, 617 [NASA ADS] [CrossRef] [EDP Sciences] [Google Scholar]
- Poveda, A., Ruiz, J., & Allen, C. 1967, Boletin de los Observatorios Tonantzintla y Tacubaya, 4, 86 [Google Scholar]
- Quintana, A. L., Wright, N. J., & Martínez García, J. 2025, MNRAS, 538, 1367 [Google Scholar]
- Reed, B. C. 2005, AJ, 130, 1652 [NASA ADS] [CrossRef] [Google Scholar]
- Renzo, M., Zapartas, E., de Mink, S. E., et al. 2019, A&A, 624, A66 [NASA ADS] [CrossRef] [EDP Sciences] [Google Scholar]
- Rigoselli, M., Mereghetti, S., Halpern, J. P., Gotthelf, E. V., & Bassa, C. G. 2024, ApJ, 976, 228 [Google Scholar]
- Robitaille, T. P., & Whitney, B. A. 2010, ApJ, 710, L11 [NASA ADS] [CrossRef] [Google Scholar]
- Rozwadowska, K., Vissani, F., & Cappellaro, E. 2021, New Astron., 83, 101498 [NASA ADS] [CrossRef] [Google Scholar]
- Rutledge, R. E., Fox, D. B., & Shevchuk, A. H. 2008, ApJ, 672, 1137 [NASA ADS] [CrossRef] [Google Scholar]
- Sana, H., de Mink, S. E., de Koter, A., et al. 2012, Science, 337, 444 [Google Scholar]
- Sana, H., Ramírez-Agudelo, O. H., Hénault-Brunet, V., et al. 2022, A&A, 668, L5 [NASA ADS] [CrossRef] [EDP Sciences] [Google Scholar]
- Schady, P., Eldridge, J. J., Anderson, J., et al. 2019, MNRAS, 490, 4515 [NASA ADS] [CrossRef] [Google Scholar]
- Silva, M. D. V., & Napiwotzki, R. 2011, MNRAS, 411, 2596 [Google Scholar]
- Smartt, S. J. 2015, PASA, 32, e016 [NASA ADS] [CrossRef] [Google Scholar]
- Stone, R. C. 1991, AJ, 102, 333 [NASA ADS] [CrossRef] [Google Scholar]
- Stoop, M., de Koter, A., Kaper, L., et al. 2024, Nature, 634, 809 [Google Scholar]
- Weidner, C., & Vink, J. S. 2010, A&A, 524, A98 [NASA ADS] [CrossRef] [EDP Sciences] [Google Scholar]
- Zwicky, F. 1957, Morphological Astronomy (Berlin-Göttingen-Heidelberg: Springer-Verlag) [Google Scholar]
All Tables
All Figures
|
Fig. 1. Initial (blue dots) and final (red crosses) distribution of the runaway stars in the R-z plane, where R corresponds to the Galactocentric radial distance and z to the height above the Galactic plane. |
| In the text | |
|
Fig. 2. Final CDF of the height above the Galactic plane, |z| (solid line). The vertical lines mark the scale height of the initial distribution (dashed line), 1 kpc (dash-dotted line), and the value of z below which 95% of runaway stars are concentrated (dotted line). |
| In the text | |
|
Fig. 3. CDF of the absolute value of the height above the Galactic plane, |z|, for SNRs originating from CCSNe (solid line) and SNe Ia (dashed line). The vertical dotted line is at 1 kpc. The CDF of SNRs originating from CCSNe is normalized to 28, as the rate of CCSNe is 28 times higher than that of SNe Ia. As SNe Ia from the thin disk are excluded from this calculation, only the difference for |z|≥1 kpc should be observed. |
| In the text | |
Current usage metrics show cumulative count of Article Views (full-text article views including HTML views, PDF and ePub downloads, according to the available data) and Abstracts Views on Vision4Press platform.
Data correspond to usage on the plateform after 2015. The current usage metrics is available 48-96 hours after online publication and is updated daily on week days.
Initial download of the metrics may take a while.