Fig. 2
Download original image
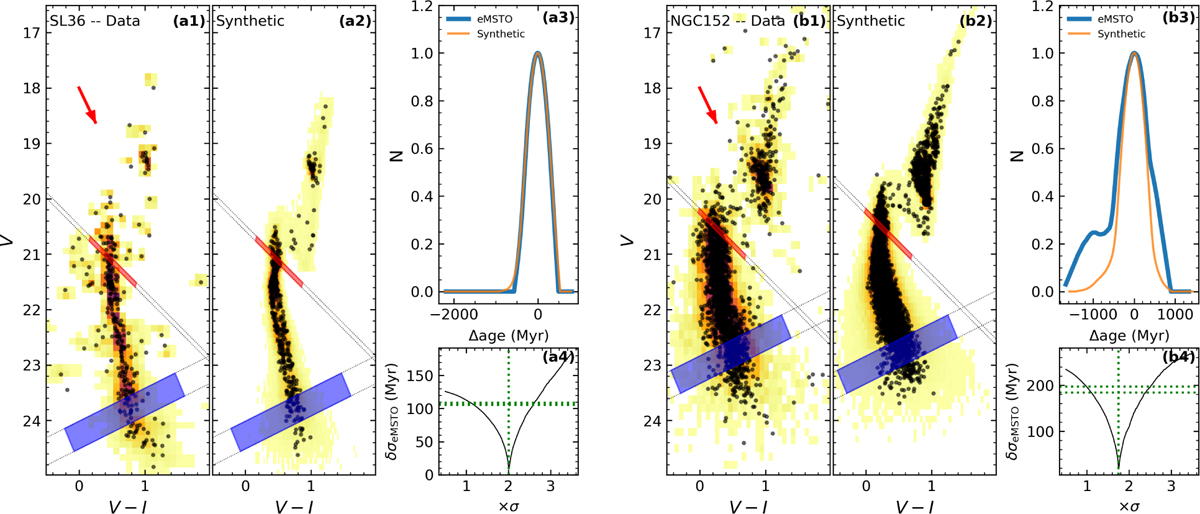
Hess diagrams for SL36 (left) and NGC 152 (right) showing the MSTO width derivation. Panels a1 and b1 show the observed data expanded via MCSim. The synthetic CMDs generated from the best isochrone fitting are shown in panels a2 (SL36) and b2 (NGC 152). The red arrow represents the reddening vector for a E(B- V) = 0.2. The age distribution along the eMSTO is shown in panels a3 (SL36) and b3 (NGC 152). The synthetic CMDs were generated by assuming scaled errors using the MS control sample and are demonstrated in panels a4 (SL36) and b4 (NGC 152). The dotted black lines in panels a1, a2, b1, and b2 are the support lines to construct the eMSTO parallelogram (red shaded region) and the MS control sample (blue shaded region). The vertical green line in panels a4 and b4 shows the best error scale, and the horizontal line is the mean age standard deviation in the MS control sample used as an error for the MSTO width.
Current usage metrics show cumulative count of Article Views (full-text article views including HTML views, PDF and ePub downloads, according to the available data) and Abstracts Views on Vision4Press platform.
Data correspond to usage on the plateform after 2015. The current usage metrics is available 48-96 hours after online publication and is updated daily on week days.
Initial download of the metrics may take a while.