| Issue |
A&A
Volume 701, September 2025
|
|
|---|---|---|
| Article Number | A221 | |
| Number of page(s) | 8 | |
| Section | Galactic structure, stellar clusters and populations | |
| DOI | https://doi.org/10.1051/0004-6361/202555201 | |
| Published online | 19 September 2025 | |
The VISCACHA survey
XIII. The extended main-sequence turnoff in intermediate-age low-mass clusters
1
Max Planck Institute for Astronomy,
Königstuhl 17,
69117
Heidelberg,
Germany
2
Universidade de São Paulo, IAG,
Rua do Matão 1226, Cidade Universitária,
São Paulo
05508-900,
Brazil
3
Instituto de Astronomía, Universidad Nacional Autónoma de México,
A. P. 106, C.P. 22800,
Ensenada,
B.C.,
Mexico
4
Instituto de Astrofísica, Departamento de Física y Astronomía, Facultad de Ciencias Exactas, Universidad Andres Bello,
Fernandez Concha, 700,
Las Condes,
Santiago,
Chile
5
Universidade Estadual de Santa Cruz, DCEX,
Rod. Jorge Amado km 16,
Ilhíeus
45662-900,
Bahia,
Brazil
6
Astronomical Observatory, University of Warsaw,
Al. Ujazdowskie 4,
00-478
Warszawa,
Poland
7
Departamento de Física, ICEx – UFMG,
Av. Antônio Carlos 6627,
Belo Horizonte
31270-901,
Brazil
8
Universidade Federal do Rio de Janeiro,
Av. Athos da Silveira, 149, Cidade Universitária,
Rio de Janeiro
21941-909,
Brazil
9
Universidade Federal do Rio Grande do Sul, Departamento de Astronomia, CP15051,
Porto Alegr,
91501-970,
Brazil
10
Instituto de Astrofísica de La Plata (CONICET-UNLP),
Paseo del bosque S/N,
La Plata (B1900FWA),
Argentina
11
Facultad de Ciencias Astroníomicas y Geofísicas – Universidad Nacional de La Plata,
Paseo del Bosque S/N,
La Plata (B1900FWA),
Argentina
12
Vatican Observatory,
V00120
Vatican City State,
Italy
13
ESO – European Southern Observatory,
Alonso de Cordova 3107,
Vitacura,
Santiago,
Chile
14
Universidad Católica del Norte, Núcleo UCN en Arqueología Galáctica - Inst. de Astronomía,
Av. Angamos 0610,
Antofagasta,
Chile
15
Laboratório Nacional de Astrofísica LNA/MCTI,
37504-364,
Itajubá,
MG,
Brazil
16
NSF NOIRLab/NSF–DOE Vera C. Rubin Observatory HQ,
950 N. Cherry Ave.,
Tucson,
AZ
85719,
USA (AURA Staff)
★ Corresponding author: This email address is being protected from spambots. You need JavaScript enabled to view it.
Received:
18
April
2025
Accepted:
21
July
2025
Abstract
The extended main-sequence turnoff (eMSTO), a significant broadening of the MSTO region, is a well-known feature observed in young and intermediate-age star clusters. Although prolonged star formation and stellar rotation have been proposed as possible explanations for this extension, no consensus has yet been reached. Most previous studies have focused on high-mass clusters. In this work, we extend the analysis to the less explored low-mass regime by investigating star clusters in the Magellanic Clouds using data from the VISCACHA survey. We employed a widely used method to quantify the MSTO width in terms of age spread. Additionally, to validate our approach, we used a cluster also observed with the HST. Our analysis confirms that the eMSTO phenomenon is also present in low-mass clusters and follows the known age– and mass–MSTO width relations. In particular, the least massive cluster in our sample does not show an eMSTO; this is further evidence in support of the proposed link between the eMSTO and the escape velocity of the cluster and provides a new lower limit to the age spread of 88 ± 40 Myr for the presence of an eMSTO. The consistent MSTO width measurements of the VISCACHA and HST photometries confirm the robustness of our method and demonstrate that the age spread determination is independent of the photometric system, showing also the power of ground-based observations for investigations of the eMSTO phenomenon.
Key words: stars: fundamental parameters / Hertzsprung–Russell and C–M diagrams / Magellanic Clouds / galaxies: photometry / galaxies: star clusters: general
© The Authors 2025
 Open Access article, published by EDP Sciences, under the terms of the Creative Commons Attribution License (https://creativecommons.org/licenses/by/4.0), which permits unrestricted use, distribution, and reproduction in any medium, provided the original work is properly cited.
This article is published in open access under the Subscribe to Open model.
Open Access funding provided by Max Planck Society.
1 Introduction
Extended main-sequence turnoff (eMSTO) is a common feature in the colour-magnitude diagrams (CMDs) of intermediate-age star clusters (∼1–2 Gyr); it was first detected in massive clusters of the Magellanic Clouds (MCs) by the Hubble Space Telescope (HST; Mackey & Broby Nielsen 2007; Mackey et al. 2008; Glatt et al. 2008) and later in observations of Milky Way open clusters (MWOCs) by Gaia (Marino et al. 2018; Bastian & Lardo 2018; Cordoni et al. 2018, among others). The groundbreaking work by Mackey & Broby Nielsen (2007), followed by many studies (e.g. Goudfrooij et al. 2009, 2011), initially interpreted it as evidence of an age spread of 100–700 Myr. This scenario was contested by the discovery of eMSTOs in young clusters (<1 Gyr), where large age spreads caused by ongoing star formation have not been observed so far (e.g. Bastian & Silva-Villa 2013; Niederhofer et al. 2015; Cabrera-Ziri et al. 2016b). Alternative interpretations have arisen, including stellar rotation and binary effects (e.g. Bastian & de Mink 2009; Yang et al. 2013; Sun et al. 2019; Ettorre et al. 2025), but no consensus has been reached.
The first analysis of the star cluster NGC1846 of the Large Magellanic Cloud (LMC) by Mackey & Broby Nielsen (2007) using the HST Advanced Camera for Surveys (ACS) data and the subsequent analysis of a larger sample by Goudfrooij et al. (2011, 2009, 2014) were mainly focused on the relatively high-mass stars clusters (>2 × 10⁴ M⊙) with ages spanning from 1 to 2 Gyr. This mass regime includes clusters with more populated CMDs observed with the HST. Goudfrooij et al. (2014) demonstrated that the MSTO width correlates with the cluster mass, escape velocity, and age, suggesting that the cluster dynamics play a role in the eMSTO phenomenon. Niederhofer et al. (2015) extended this study to young massive star clusters (YMCs), showing, however, that the cluster age also plays an important role in determining the presence of eMSTOs since the YMCs analysed seem not to present this feature in their CMDs. Later, Piatti & Bastian (2016b) analysed four LMC clusters with masses <5 × 10³M⊙, which is approximately one order of magnitude lower than those observed with the HST. They observed that low-mass clusters also exhibit an eMSTO, suggesting that cluster mass is not the primary factor controlling the phenomenon.
On the other hand, stellar rotation models have gained traction by reproducing eMSTO morphologies without invoking age spreads, which means that different rotational velocities within a single-age population could broaden the MSTO (e.g. Brandt & Huang 2015; Georgy et al. 2019). One primary effect of stellar rotation is that it carries hydrogen (H) from the outer layers to the nucleus, and this mixing keeps the star in the main-sequence (MS) phase for a longer time. Since different stars have different rotation rates, this effect will also impact them differently, making the MSTO in the CMD wider, as an extended star formation period would do (gyrochronology; Bastian & de Mink 2009; Vidotto et al. 2014; Niederhofer et al. 2015). These models predict a peak in the MSTO width (full width at half maximum) at intermediate ages since stellar rotation effects maximise near the end of the MS, which is followed by a decline due to angular momentum loss from magnetic braking (e.g. Georgy et al. 2019). Bodensteiner et al. (2023) analysed a sample of Be stars of the ~35Myr old star cluster NGC330 of the Small Magellanic Cloud (SMC), combining photometric data from the HST with spectroscopic data from MUSE. They find that the fastrotating stars are mainly redder and fainter than the rest of the MSTO. The rotation distribution along the MSTO happens in part because the equatorial disc present in some of those stars (e.g. Be; Labadie-Bartz et al. 2022) can, depending on the inclination angle of the disc with respect to the observer, obscure the star in the optical, changing their position in the CMD and generating the eMSTO. Maurya et al. (2024) observed the same for the open cluster NGC 2355 using Gaia Data Release 3 photometry combined with FLAMES-UVES spectroscopic data.
Despite this, the low-mass regime in the MCs is less explored than the high-mass end. Previous studies have demonstrated a simultaneous correlation between the presence of an eMSTO and cluster mass, as well as between the presence of an eMSTO and cluster age. This degeneracy explains the presence of the eMSTO in low-mass clusters by invoking stellar rotation, as those clusters are in the age regime of high rotation activity. Therefore, the low-mass clusters are crucial to understanding the origin of eMSTOs. The present work presents a comprehensive analysis of MSTO widths in a broad sample of MC star clusters from the VIsible Soar photometry of star Clusters in tApii and Coxi HuguA survey1 (VISCACHA; Maia et al. 2019) collected using the SOuthern Astrophysical Research (SOAR) telescope. Thanks to the SOAR Adaptive Module Imager (SAMI; Tokovinin et al. 2016), we managed to resolve small, crowded regions to observe star clusters in the MCs within a mass regime lower than the one observed before using the HST. The primary goal is to demonstrate that it is possible to observe the eMSTO phenomenon using VISCACHA ground-based data. Then, by combining deep ground-based photometry with high-resolution space-based data for the method benchmark, we also investigated the dependence of MSTO widths on cluster mass, escape velocity, and age.
This work is organised as follows: Section 2 presents the star cluster data and the differential reddening correction method. Section 3 discusses the parametrisation of the eMSTO we employed and the selection of MSTO stars for the MSTO width calculation. Section 4 shows the eMSTO in low-mass clusters. Finally, Sect. 5 presents the conclusions.
2 VISCACHA data
Our star cluster sample selection is based on clusters that showed a more populated CMD from the first VISCACHA internal data release (IDR1): NGC 2241, SL28, SL36, SL61, SL576, Kron 37, Lindsay 106, and NGC 152. All clusters are within the age range classified as intermediate-age, ~1-3 Gyr, which predicts the presence of a more evident eMSTO (e.g. Yang et al. 2013; Goudfrooij et al. 2014).
We exploited the SAMI/SOAR (Tokovinin et al. 2016) instrument, which delivers high-quality images in V and I-bands (using the Kron-Cousins BVRI set) due to its adaptive optics module delivering image quality of ~0.3"-0.4". The data reduction is based on Diolaiti et al. (2000) – more details can be found in Maia et al. (2019). The adaptive optics module also allowed us to reach a photometric limit level V ~ 23 mag with ~0.1 mag precision within the clusters’ core radius, which cannot be obtained with ground-based telescope, making it possible to analyse stars including in the crowded region of the cluster.
As a benchmark for the following methodology, we analysed the HST data for the cluster NGC 152 in parallel with VISCACHA data. The data were compiled from the literature by Milone et al. (2023). We processed the HST data using the same reddening correction and MSTO width measurement methods applied to the VISCACHA data, which are described in the following sections.
To account for field star contamination, we applied a statistical decontamination method, as described by Maia et al. (2010). This technique compares the CMD of the cluster region (defined as half of the tidal radius, Ferreira et al. 2025) to that of a nearby field region of equal area and similar extinction. The CMDs are divided into cells in the CMD, and stars are statistically removed based on overdensities. Final membership probabilities are assigned based on multiple realisations with varying grid configurations. Only stars with high membership are retained in the analysis, ensuring that field contamination is minimised even in the outer regions of the cluster. We refer the reader to Maia et al. (2010), Oliveira et al. (2023), Ferreira et al. (2024), and Ferreira et al. (2025) for a more detailed description of the method.
After that, we adopted the widely used methodology in the literature for the differential reddening correction (e.g. Alonso-García et al. 2012; Bellini et al. 2017; Souza et al. 2021, 2023, 2024), making some modifications that are briefly described below. The differential reddening correction is particularly important because the spread caused by it can reproduce a fake eMSTO, as observed by Platais et al. (2012) for the ~ 1.3 Gyr old open cluster Trumpler 20 using an analysis combining BVI photometry with FLAMES spectroscopic data.
First, a linear transformation is applied to both the CMD and the fiducial line to transform the V versus V - I CMD in a V0 versus E(V - I) plane, where V0 and the E(V — I) are the absorption-corrected V magnitude and the colour excess, respectively. In this procedure, we used the relative absorption coefficients for V and I bands (RV = 3.1 and RI = 1.87, from PARSEC database2). After the transformation, the distance between each star and the fiducial line in the abscissa axis is the initial guess for their colour excess. A second step is to smooth the initial guess, taking the median colour excess of the k-nearest neighbours in RA and Dec This procedure is repeated until there is no variation in the locus of the fiducial line. After that, the corrected V0 versus E(V - I) plane is converted into V versus V - I using the inverse transformation. Then, the difference between the original V and V - I position of the star and its new corrected position is converted into the intrinsic colour excess E(B - V), which is used to construct the differential reddening map.
The method is applied typically to stars fainter than the turnoff because the MS is more densely populated. However, the clusters analysed in this work have low masses, so the limited number of stars poses a challenge for the traditional reddening correction method. To mitigate this limitation, we implemented a Monte Carlo simulation (MCSim) that accounts for stellar magnitude uncertainties. The MCSim is used to construct the reddening map across the cluster. The differential reddening corrections for the observed stars are then interpolated using this grid map. Figure 1 presents two examples of the reddening correction: one for a cluster without an eMSTO (SL36; top panels) and another showing evidence of eMSTO (SL61; bottom panels). The differential reddening-corrected CMDs for all clusters are given in Fig. A.1. Even though our method significantly reduces the impact of differential reddening, some residual effects may still be present in the CMDs.
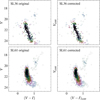 |
Fig. 1 CMDs for the clusters SL36 (top panels) and SL61 (bottom panels) before (left) and after (right) differential reddening correction. |
3 eMSTO parametrisation
Previous studies have shown that the intrinsic MSTO spread due to stellar rotation, in theoretical evolutionary models, increases with cluster age up to ~1.5 Gyr before decreasing again and becoming negligible around 3 Gyr (Yang et al. 2013; Niederhofer et al. 2015). Also, the observed MSTO width, in star clusters, when expressed in terms of age spread, follows the same trend (Goudfrooij et al. 2014). Although the MSTO width in terms of age spread could suggest prolonged star formation, it serves as a useful, standardised measure, allowing for comparisons across different photometric systems. Therefore, in the following discussion, we adopt the MSTO width in the age spread form as an indirect indicator of the presence of an eMSTO.
To obtain a representative sample of the eMSTO stars, we adapted the methodology described in Goudfrooij et al. (2014) and Correnti et al. (2021), summarised in Fig. 2. The approach involves defining the eMSTO region within a parallelogram (solid lines and red-shaded region in panels a1, a2, b1, and b2 of Fig. 2), specifically in the area where isochrones are sensitive to age differences.
The left and right boundaries of the parallelogram are set as perpendicular lines to the reddening vector (red arrow in Fig. 2), enclosing all MSTO stars along the full extent of the colour spread. The upper and lower boundaries are approximately aligned with the reddening vector, as differential reddening effects are reduced in that direction. The upper boundary is positioned 0.75 magnitudes above the turnoff, corresponding to the turnoff of equal-mass binaries. The lower boundary varies for each cluster to ensure that at least 1% of the stars are included within the final parallelogram. Panels a1, a2, b1, and b2 of Fig. 2 illustrate the final parallelogram for SL36 (left) and NGC152 (right) as a solid black outline with the red-shaded region.
The stars within the parallelogram were then interpolated into a grid of isochrones with different ages to derive their age values. Our isochrone grid is based on the PARSEC database (Bressan et al. 2012), covering ages from 700 Myr to 3.5 Gyr in 100 Myr steps. We also accounted for a range of metallicities3, spanning from −1.0 to 0.3 with a fine step size of 0.01. The resulting age distribution was then smoothed using an Epanechnikov kernel, which is less sensitive to standard deviation than a Gaussian kernel (see panels a3 and b3 of Fig. 2).
Next, we constructed the synthetic single stellar population cluster using the cluster parameters obtained from the best isochrone fit of the cluster using the SIESTA4 code (Ferreira et al. 2024). Cluster mass values were taken from Santos et al. (2020), except for NGC 152, for which we adopted the estimate from Gatto et al. (2021). A summary of all adopted values and references is provided in Table 1. We also employed the Kroupa (2001) initial mass function and excluded synthetic stars to replicate the observed cluster luminosity function. Notably, our synthetic population was designed to closely reproduce the observed CMD, including the presence of binary stars.
To account for possible under- or overestimated magnitude errors, we also defined a control parallelogram located at the MS, a few magnitudes fainter than the turnoff (blue shaded region in panels a1, a2, b1, and b2 of Fig. 2, following Correnti et al. 2021). This control region helps assess the impact of photometric errors on the synthetic population. We systematically increased the contribution of errors in the synthetic CMD until the standard deviation in the control region matched that of both the observed and synthetic CMDs. The remaining residual difference was then considered as an additional source of uncertainty in our MSTO width determinations (panels a4 and b4 of Fig. 2).
Finally, similar to the differential reddening correction, we found that the MCSim improved the accuracy of our calculations. Therefore, we applied the parallelogram selection and MSTO width determination within the MCSim framework.
After satisfying the control test in the MS, the age distributions for the original MCSim and synthetic CMD eMSTO were obtained. The width was calculated as follows (Goudfrooij et al. 2014):
 (1)
(1)
where FWHM is the full width at half of the maximum. The values derived for all clusters in this work are summarised in Table 1 and shown in Fig. 3.
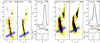 |
Fig. 2 Hess diagrams for SL36 (left) and NGC 152 (right) showing the MSTO width derivation. Panels a1 and b1 show the observed data expanded via MCSim. The synthetic CMDs generated from the best isochrone fitting are shown in panels a2 (SL36) and b2 (NGC 152). The red arrow represents the reddening vector for a E(B- V) = 0.2. The age distribution along the eMSTO is shown in panels a3 (SL36) and b3 (NGC 152). The synthetic CMDs were generated by assuming scaled errors using the MS control sample and are demonstrated in panels a4 (SL36) and b4 (NGC 152). The dotted black lines in panels a1, a2, b1, and b2 are the support lines to construct the eMSTO parallelogram (red shaded region) and the MS control sample (blue shaded region). The vertical green line in panels a4 and b4 shows the best error scale, and the horizontal line is the mean age standard deviation in the MS control sample used as an error for the MSTO width. |
Fundamental parameters assumed for this work (3–10) and values derived from our analysis (13 and 14).
4 The eMSTO in low-mass clusters
To benchmark our method, we applied the same analysis to NGC 152 using both HST (cyan dot in Fig. 3) and VIS-CACHA (grey dot in Fig. 3) data. Further details can be found in Appendix B and Fig. B.1. The MSTO width values obtained from the two datasets agree within 1σ to 2σ. Since our analysis helps mitigate the effects of differential reddening and photometric errors, the remaining differences could be attributed to variations in the isochrone fitting values between the VISCACHA and HST datasets. Milone et al. (2023) selected the isochrone that best fits the upper density of the MSTO as the optimal fit. Despite this difference in approach, our validation test confirms that the methodology is consistent across different photometric systems. Furthermore, the agreement in MSTO width between the two photometric datasets reinforces that our method effectively identifies the presence of eMSTO, which is clearly visible in the HST data. Another key observation is the existence of a cluster without eMSTO (green dot in Fig. 3), which is represented by a null width. This indicates that its observed width matches that of a synthetic single stellar population, confirming the absence of eMSTO in this case.
We performed the generalised Kendall correlation test to verify the correlation between the MSTO width and the parameters involved in this work. All the values are summarised in Table 2. We compared them with the values taken directly from Goudfrooij et al. (2014). The cluster mass and escape velocity values assumed in this work from Goudfrooij et al. (2014) are regarding the present day, allowing for a direct comparison with our results.
The linear relation between the MSTO width and the cluster mass (in log scale, panel a of Fig. 3) and escape velocity (panel b) reported by Goudfrooij et al. (2014, yellow squares) is well extended by our results in the low-mass regime (coloured dots). The (present-day) escape velocity was derived using the same equation as Georgiev et al. (2009) and Cabrera-Ziri et al. (2016a):
![Mathematical equation: \displaystyle v_{esc} = f_c \times \sqrt{\frac{M_{cls}[M_\odot]}{r_{\rm eff}[\rm pc]}} \,\,\,[\rm km\,s^{-1}],](/articles/aa/full_html/2025/09/aa55201-25/aa55201-25-eq2.png) (2)
(2)
where reff is the effective radius. For the parameter fc, we assumed the same value as Cabrera-Ziri et al. (2016a) of 0.076, which was calculated for diffuse clusters using a King (1962) profile given by Georgiev et al. (2009). For the effective radii, we used the half-light radii (as in Georgiev et al. 2009) from Santos et al. (2020) except for NGC152, for which we assumed the value from Gatto et al. (2021). The Kendall correlation test revealed a strong positive correlation between mass and escape velocity, with the MSTO width represented by the positive τ value and a low pτ value. Besides that, the Kendall test values are similar to those obtained by Goudfrooij et al. (2014), also observed by the linear regression in panels a and b of Fig. 3.
Since the cluster masses adopted in this work refer to their present-day values, one possible explanation for having similar MSTO widths across clusters with different current masses is the effect of tidal interactions experienced within the dwarf galaxy environment (e.g. Moreno-Hilario et al. 2024). Thus, while the initial mass may be key to the origin of the eMSTO, the current mass, when considered alongside the MSTO width, can also offer valuable insights into the cluster’s dynamic history and the broader galactic environment of the MCs.
Although our sample displays a clear linear correlation between the MSTO width and the cluster mass/vesc, the low-mass clusters analysed by Piatti & Bastian (2016a,b, yellow stars in Fig. 3) do not present any trend. In their sample, two clusters have MSTO widths of ∼300 Myr, while the other two have widths of ∼200 Myr. Nevertheless, when observing their ages (panels c and d), the two clusters with high MSTO width are in perfect agreement with the pattern observed for Goudfrooij et al. (2014) data and explained by stellar rotation, as claimed by Piatti & Bastian (2016a,b). On the other hand, the two clusters with low MSTO width follow the same behaviour as our values for NGC2241 (blue) and SL61 (red), showing a possible common stellar rotation rate sequence. For completeness purposes, we also included the MWOCs from Cordoni et al. (2018, yellow triangles in Fig. 3), which indicates a plateau around 150 Myr.
In comparison with Niederhofer et al. (2015, yellow crosses in Fig. 3) for YMCs of MCs using the HST, our sample also shows essentially higher values of MSTO width. The three clusters in our sample that have width values below the limit (blue squares and the dashed blue line in Fig. 3) agree with the Niederhofer et al. (2015) sample. Looking at panels c and d of Fig. 3, it is clear that the relationship between the width and the cluster mass (and escape velocity) also depends on the cluster age (Yang et al. 2013; Niederhofer et al. 2015). This suggests that the eMSTO would be a transient phenomenon in terms of age but intrinsically related to the cluster mass. From the high Kendall pτ values, no correlation is found between the MSTO width and the cluster age.
Although the eMSTO feature was first identified in star clusters from the MCs, it has also been observed in MWOCs (Marino et al. 2018). This finding is significant because MWOCs can be similarly young (<2 Gyr), suggesting that eMSTOs are a common characteristic of young star clusters, regardless of their environment. In MWOCs, Marino et al. (2018) also detected a substantial population of fast-rotating stars in the MSTO region, supporting the hypothesis that stellar rotation plays a central role in the eMSTO phenomenon. Moreover, this mechanism could represent the early phase of the multiple stellar population phenomenon observed in older globular clusters. In this context, fast-rotating stars in young clusters could enrich the intra-cluster medium, leading to the chemical variations later seen in clusters older than ∼2 Gyr (Martocchia et al. 2018) and globular clusters (Bastian & Lardo 2018; Milone & Marino 2022). The young massive clusters from Niederhofer et al. (2015) do not yet exhibit eMSTOs in their CMDs, likely because their ages are still below the threshold where rotation-induced effects become observable. In contrast, our sample covers an age range associated with peak stellar rotation efficiency, allowing us to detect a clear correlation between MSTO width and cluster mass. This age-dependent trend is also present in the MWOCs studied by Cordoni et al. (2018), which match the younger end of the Niederhofer et al. (2015) sample (see panel c of Fig. 3).
To explain the large width spread in panel d of Fig. 3, we compared our results with stellar rotation models using PARSEC isochrones (Nguyen et al. 2022) with a fixed metallicity of [M/H] = –0.60, approximately the mean metallicity of our sample. The theoretical MSTO widths were derived using the same approach as for the observed data. We first selected the isochrone with a specific rotation rate. Then, we considered all the available inclination angles. With the set of isochrones having the same metallicity and rotation rate but different inclination angles, we interpolated the points as made for the cluster CMDs. The reference grid was composed of non-rotating isochrones of different ages. Finally, to account for any offset, we used the isochrone with an inclination angle of 60 degrees, which accurately reproduces the isochrone without rotation. We repeated this procedure for all the ages from 10 Myr to 3 Gyr. We find that clusters with broader eMSTOs are associated with higher rotation rates (Ω/ΩC ≥ 0.5), supporting the scenario in which differential rotation broadens the MSTO.
Our result complements the lack of low-mass clusters in the study of the eMSTO. The presence of eMSTOs in low-mass clusters indicates a more universal mechanism, potentially linked to fundamental stellar evolutionary processes rather than specific cluster properties. Future investigations, including spectroscopic follow-ups and more detailed modelling, will be crucial to disentangling the relative contributions of rotation, age spreads, and cluster dynamics in shaping the eMSTO phenomenon.
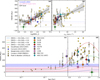 |
Fig. 3 MSTO width at 50% of the maximum (FWHM) as a function of cluster mass (panel a), escape velocity (panel b), and age (panels c and d). The coloured dots represent the star clusters analysed in this work. Yellow squares represent MCs clusters from Goudfrooij et al. (2014), blue squares clusters analysed by Correnti et al. (2014) and used by Goudfrooij et al. (2014) as a lower limit for the existence of the eMSTO, and YMCs analysed by Niederhofer et al. (2015) as yellow crosses. Yellow triangles show MWOCs from Cordoni et al. (2018). The yellow stars are the results by Piatti & Bastian (2016a,b). The colored dotted lines illustrate the expected MSTO width, comparing non-rotating isochrones with models for different rotation fractions - Ω/ΩC = 0.3 (blue), 0.6 (orange), 0.8 (green), and 0.99 (red) - adopting the metallicity of [M∕H]= −0.6 (the mean of our sample). The horizontal dashed blue line represents previous limits from Correnti et al. (2014) and Goudfrooij et al. (2014), while the pink line and shaded region mark the eMSTO limit derived in this work. The black lines in panels a and b represent the linear regression for the data from Cordoni et al. (2018, dotted), Goudfrooij et al. (2014, dashed), and this work (solid). The grey shaded regions represent the standard deviation of the fit. |
Correlation coefficient and p-value for a generalised Kendall test.
5 Conclusions
In this work, we have investigated the presence of eMSTOs in a sample of eight intermediate-age star clusters from the VISCACHA survey using deep ground-based photometry from the SOAR telescope. Our analysis explored the dependence of MSTO widths on cluster mass, escape velocity, and age, expanding previous studies to the lower-mass cluster end. The main conclusions of our study are summarised as follows:
The comparison between the MSTO widths derived from VISCACHA data and the HST benchmark for NGC152 confirms the robustness of our methodology, validating the reliability of ground-based observations for studying eMSTOs in low-mass clusters;
We detect eMSTOs, via non-negligible MSTO width values, in the majority of the analysed clusters, confirming that the phenomenon is not restricted to high-mass clusters;
One cluster shows no eMSTO, i.e. the MSTO width is zero. However, this cluster is also the oldest in our sample, located in the age regime where stellar rotation becomes less efficient;
We find a cluster, L106, with an age at the peak of stellar rotation activity that presents a MSTO width narrower than the previously assumed lower limit. Therefore, we propose a new lower limit for the presence of eMSTOs of around 90 Myr for the MSTO width measured in terms of pseudoage spread;
Our results reveal a correlation between MSTO width and cluster mass, as well as escape velocity, consistent with previous findings (e.g. Goudfrooij et al. 2014; Correnti et al. 2014);
The MSTO widths in our sample also exhibit the predicted age dependence, peaking at intermediate ages and decreasing at older ages, consistent with the scenario where stellar rotation effects maximise near the end of the MS and diminish due to angular momentum loss (e.g. Georgy et al. 2019), confirming the phenomenon known as gravity darkening.
These results expand our understanding of eMSTOs in star clusters, particularly in the low-mass regime. They suggest that stellar rotation could be a dominant factor influencing eMSTO morphology – though not the sole factor, as previous studies have suggested. Our results once more demonstrate the reliability of using ground-based photometry and the power of the adaptive optics instrument at SOAR. The VISCACHA collaboration has a great opportunity to study the eMSTO origin in more detail for the low-mass end since we possess observations for star clusters spread along the SMC and LMC, as well as in the Magellanic Bridge. Further investigations, combining spectroscopic data to probe rotational velocities and chemical abundances, will be crucial to fully unraveling the origin of the eMSTO in star clusters.
Acknowledgements
The authors are grateful to the anonymous referee for their suggestions and remarks, which greatly improved the paper. Many thanks to Dr. Thanh Nguyen for the discussion and insights about the new set of PARSEC isochrones. We thank Peter Smith from the Galactic Nuclei group at MPIA for the discussion about escape velocity. SOS acknowledges the support from Dr. Nadine Neumayer’s Lise Meitner grant from the Max Planck Society, and FAPESP (proc. 2018/22044-3). APV and SOS acknowledge the DGAPA–PAPIIT grant IA103224. BD acknowledges support by ANID-FONDECYT iniciaciíon grant No. 11221366 and from the ANID BASAL project FB210003. L.O.K. acknowledges partial financial support by CNPq (proc. 313843/2021-0) and UESC (proc. 073.6766.2019.0013905-48). BPLF acknowledges financial support from Conselho Nacional de Desenvolvimento Científico e Tecnolíogico (CNPq, Brazil; proc. 140642/2021-8) and Coordenação de Aperfeiçoamento de Pessoal de Nível Superior (CAPES, Brazil; Finance Code 001; proc. 88887.935756/202400). BB acknowledges partial financial support from FAPESP, CNPq and CAPES financial code 001. E.R.G. gratefully acknowledges support from ANID PhD scholarship No. 21210330. GB acknowledges CONICET PIP 112-202101-00714 and Agencia I+D+i PICT 2019-0344. D.M. gratefully acknowledges support from the ANID BASAL projects ACE210002 and FB210003, from Fondecyt Project No. 1220724, and from CNPq Brasil Project 350104/2022-0. FFSM acknowledges support from CNPq (proc. 404482/2021-0) and FAPERJ (proc. E-26/201.386/2022 and E-26/211.475/2021). J.G.F-T gratefully acknowledges the grant support provided by Proyecto Fondecyt Iniciación No. 11220340, and also from the Joint Committee ESO-Government of Chile 2021 (ORP 023/2021). E.B. acknowledges CNPq for support. NSF–DOE Vera C. Rubin Observatory is a Federal project jointly funded by the National Science Foundation (NSF) and the Department of Energy (DOE) Office of Science, with early construction funding received from private donations through the LSST Corporation. The NSF-funded LSST (now Rubin Observatory) Project Office for construction was established as an operating centre under the management of the Association of Universities for Research in Astronomy (AURA). The DOE-funded effort to build the Rubin Observatory LSST Camera (LSSTCam) is managed by SLAC National Accelerator Laboratory (SLAC). The work is based on observations obtained at the Southern Astrophysical Research (SOAR) telescope (projects SO2016B-018, SO2017B-014, CN2018B-012, SO2019B-019, SO2020B-019, SO2021B-017), which is a joint project of the Ministíerio da Ciência, Tecnologia, e Inovaç ao (MCTI) da República Federativa do Brasil, the U.S. National Optical Astronomy Observatory (NOAO), the University of North Carolina at Chapel Hill (UNC) and Michigan State University (MSU).
Appendix A Corrected CMD of all clusters
Figure A.1 shows the differential reddening corrected CMD for all clusters analysed in this work.
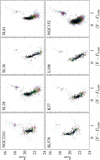 |
Fig. A.1 CMD corrected by differential reddening of all the clusters in our sample. |
Appendix B Benchmark – NGC152 HST data
To verify the feasibility of our data, we analysed the cluster NGC 152, which was also observed by the HST, providing an ideal benchmark for comparison (Fig. B.1). NGC 152 is a well-studied intermediate-age cluster in the SMC. It is known for its pronounced eMSTO, which has been widely investigated to understand age spreads and stellar rotation effects in star clusters.
We performed the decontamination of field stars using the method presented by Gallart et al. (2003) and described by Marino et al. (2014); Milone et al. (2023), which is essentially the same method as by Maia et al. (2010), widely used in the VISCACHA studies. These approaches account for the statistical subtraction of field star contamination by considering the spatial distribution and photometric properties of stars in the vicinity of the cluster. We used data from Milone et al. (2023), who provide a compilation from the HST archive.
To correct for differential reddening, we employed the same procedure used for the VISCACHA data, as explained in the main text. This step is crucial for accurately measuring the MSTO width, as differential reddening can artificially broaden the MSTO region.
After applying these corrections, we measured the MSTO widths from both the VISCACHA and HST data (Fig. B.1). The results are consistent within 1.3σ, indicating good agreement between the two datasets. This consistency validates the reliability of our decontamination and differential reddening correction methods, supporting the robustness of our analysis.
References
- Alonso-García, J., Mateo, M., Sen, B., et al. 2012, AJ, 143, 70 [Google Scholar]
- Bastian, N., & de Mink, S. E. 2009, MNRAS, 398, L11 [NASA ADS] [CrossRef] [Google Scholar]
- Bastian, N., & Silva-Villa, E. 2013, MNRAS, 431, L122 [NASA ADS] [CrossRef] [Google Scholar]
- Bastian, N., & Lardo, C. 2018, ARA&A, 56, 83 [Google Scholar]
- Bellini, A., Anderson, J., van der Marel, R. P., et al. 2017, ApJ, 842, 7 [NASA ADS] [CrossRef] [Google Scholar]
- Bodensteiner, J., Sana, H., Dufton, P. L., et al. 2023, A&A, 680, A32 [NASA ADS] [CrossRef] [EDP Sciences] [Google Scholar]
- Brandt, T. D., & Huang, C. X. 2015, ApJ, 807, 25 [NASA ADS] [CrossRef] [Google Scholar]
- Bressan, A., Marigo, P., Girardi, L., et al. 2012, MNRAS, 427, 127 [NASA ADS] [CrossRef] [Google Scholar]
- Cabrera-Ziri, I., Bastian, N., Hilker, M., et al. 2016a, MNRAS, 457, 809 [NASA ADS] [CrossRef] [Google Scholar]
- Cabrera-Ziri, I., Niederhofer, F., Bastian, N., et al. 2016b, MNRAS, 459, 4218 [NASA ADS] [CrossRef] [Google Scholar]
- Cordoni, G., Milone, A. P., Marino, A. F., et al. 2018, ApJ, 869, 139 [CrossRef] [Google Scholar]
- Correnti, M., Goudfrooij, P., Kalirai, J. S., et al. 2014, ApJ, 793, 121 [NASA ADS] [CrossRef] [Google Scholar]
- Correnti, M., Goudfrooij, P., Bellini, A., & Girardi, L. 2021, MNRAS, 504, 155 [Google Scholar]
- Diolaiti, E., Bendinelli, O., Bonaccini, D., et al. 2000, A&AS, 147, 335 [NASA ADS] [CrossRef] [EDP Sciences] [Google Scholar]
- Ettorre, G., Mazzi, A., Girardi, L., et al. 2025, MNRAS, 539, 2537 [Google Scholar]
- Ferreira, B. P. L., Santos, João F. C. J., Dias, B., et al. 2024, MNRAS, 533, 4210 [NASA ADS] [CrossRef] [Google Scholar]
- Ferreira, B. P. L., Dias, B., Santos, J. F. C., et al. 2025, A&A, 695, L9 [NASA ADS] [CrossRef] [EDP Sciences] [Google Scholar]
- Gallart, C., Zoccali, M., Bertelli, G., et al. 2003, AJ, 125, 742 [Google Scholar]
- Gatto, M., Ripepi, V., Bellazzini, M., et al. 2021, MNRAS, 507, 3312 [NASA ADS] [CrossRef] [Google Scholar]
- Georgiev, I. Y., Hilker, M., Puzia, T. H., Goudfrooij, P., & Baumgardt, H. 2009, MNRAS, 396, 1075 [NASA ADS] [CrossRef] [Google Scholar]
- Georgy, C., Charbonnel, C., Amard, L., et al. 2019, A&A, 622, A66 [NASA ADS] [CrossRef] [EDP Sciences] [Google Scholar]
- Glatt, K., Grebel, E. K., Sabbi, E., et al. 2008, AJ, 136, 1703 [Google Scholar]
- Goudfrooij, P., Puzia, T. H., Kozhurina-Platais, V., & Chandar, R. 2009, AJ, 137, 4988 [Google Scholar]
- Goudfrooij, P., Puzia, T. H., Kozhurina-Platais, V., & Chandar, R. 2011, ApJ, 737, 3 [NASA ADS] [CrossRef] [Google Scholar]
- Goudfrooij, P., Girardi, L., Kozhurina-Platais, V., et al. 2014, ApJ, 797, 35 [CrossRef] [Google Scholar]
- King, I. 1962, AJ, 67, 471 [Google Scholar]
- Kroupa, P. 2001, MNRAS, 322, 231 [NASA ADS] [CrossRef] [Google Scholar]
- Labadie-Bartz, J., Carciofi, A. C., Henrique de Amorim, T., et al. 2022, AJ, 163, 226 [NASA ADS] [CrossRef] [Google Scholar]
- Mackey, A. D., & Broby Nielsen, P. 2007, MNRAS, 379, 151 [NASA ADS] [CrossRef] [Google Scholar]
- Mackey, A. D., Broby Nielsen, P., Ferguson, A. M. N., & Richardson, J. C. 2008, ApJ, 681, L17 [NASA ADS] [CrossRef] [Google Scholar]
- Maia, F. F. S., Corradi, W. J. B., & Santos, J. F. C. J. 2010, MNRAS, 407, 1875 [NASA ADS] [CrossRef] [Google Scholar]
- Maia, F. F. S., Dias, B., Santos, J. F. C., et al. 2019, MNRAS, 484, 5702 [Google Scholar]
- Marino, A. F., Milone, A. P., Yong, D., et al. 2014, MNRAS, 442, 3044 [NASA ADS] [CrossRef] [Google Scholar]
- Marino, A. F., Milone, A. P., Casagrande, L., et al. 2018, ApJ, 863, L33 [NASA ADS] [CrossRef] [Google Scholar]
- Martocchia, S., Cabrera-Ziri, I., Lardo, C., et al. 2018, MNRAS, 473, 2688 [NASA ADS] [CrossRef] [Google Scholar]
- Maurya, J., Samal, M. R., Amard, L., et al. 2024, MNRAS, 532, 1212 [Google Scholar]
- Milone, A. P., Cordoni, G., Marino, A. F., et al. 2023, A&A, 672, A161 [NASA ADS] [CrossRef] [EDP Sciences] [Google Scholar]
- Milone, A. P., & Marino, A. F. 2022, Universe, 8, 359 [NASA ADS] [CrossRef] [Google Scholar]
- Moreno-Hilario, E., Martinez-Medina, L. A., Li, H., Souza, S. O., & Pérez-Villegas, A. 2024, MNRAS, 527, 2765 [Google Scholar]
- Nguyen, C. T., Costa, G., Girardi, L., et al. 2022, A&A, 665, A126 [NASA ADS] [CrossRef] [EDP Sciences] [Google Scholar]
- Niederhofer, F., Georgy, C., Bastian, N., & Ekström, S. 2015, MNRAS, 453, 2070 [NASA ADS] [CrossRef] [Google Scholar]
- Oliveira, R. A. P., Maia, F. F. S., Barbuy, B., et al. 2023, MNRAS, 524, 2244 [NASA ADS] [CrossRef] [Google Scholar]
- Piatti, A. E., & Bastian, N. 2016a, MNRAS, 463, 1632 [Google Scholar]
- Piatti, A. E., & Bastian, N. 2016b, A&A, 590, A50 [NASA ADS] [CrossRef] [EDP Sciences] [Google Scholar]
- Platais, I., Melo, C., Quinn, S. N., et al. 2012, ApJ, 751, L8 [NASA ADS] [CrossRef] [Google Scholar]
- Santos, J. F. C., Maia, F. F. S., Dias, B., et al. 2020, MNRAS, 498, 205 [Google Scholar]
- Saroon, S., Dias, B., Tsujimotto, T., et al. 2025, A&A, 701, A222 [Google Scholar]
- Souza, S. O., Valentini, M., Barbuy, B., et al. 2021, A&A, 656, A78 [NASA ADS] [CrossRef] [EDP Sciences] [Google Scholar]
- Souza, S. O., Ernandes, H., Valentini, M., et al. 2023, A&A, 671, A45 [NASA ADS] [CrossRef] [EDP Sciences] [Google Scholar]
- Souza, S. O., Libralato, M., Nardiello, D., et al. 2024, A&A, 690, A37 [NASA ADS] [CrossRef] [EDP Sciences] [Google Scholar]
- Sun, W., de Grijs, R., Deng, L., & Albrow, M. D. 2019, ApJ, 876, 113 [NASA ADS] [CrossRef] [Google Scholar]
- Tokovinin, A., Cantarutti, R., Tighe, R., et al. 2016, PASP, 128, 125003 [NASA ADS] [CrossRef] [Google Scholar]
- Vidotto, A. A., Gregory, S. G., Jardine, M., et al. 2014, MNRAS, 441, 2361 [Google Scholar]
- Yang, W., Bi, S., Meng, X., & Liu, Z. 2013, ApJ, 776, 112 [NASA ADS] [CrossRef] [Google Scholar]
PARSEC isochrones define metallicity as the total metal-to-hydrogen ratio, [M/H].
Publicly available at https://github.com/Bereira/SIESTA/
All Tables
Fundamental parameters assumed for this work (3–10) and values derived from our analysis (13 and 14).
All Figures
|
Fig. 1 CMDs for the clusters SL36 (top panels) and SL61 (bottom panels) before (left) and after (right) differential reddening correction. |
| In the text | |
|
Fig. 2 Hess diagrams for SL36 (left) and NGC 152 (right) showing the MSTO width derivation. Panels a1 and b1 show the observed data expanded via MCSim. The synthetic CMDs generated from the best isochrone fitting are shown in panels a2 (SL36) and b2 (NGC 152). The red arrow represents the reddening vector for a E(B- V) = 0.2. The age distribution along the eMSTO is shown in panels a3 (SL36) and b3 (NGC 152). The synthetic CMDs were generated by assuming scaled errors using the MS control sample and are demonstrated in panels a4 (SL36) and b4 (NGC 152). The dotted black lines in panels a1, a2, b1, and b2 are the support lines to construct the eMSTO parallelogram (red shaded region) and the MS control sample (blue shaded region). The vertical green line in panels a4 and b4 shows the best error scale, and the horizontal line is the mean age standard deviation in the MS control sample used as an error for the MSTO width. |
| In the text | |
|
Fig. 3 MSTO width at 50% of the maximum (FWHM) as a function of cluster mass (panel a), escape velocity (panel b), and age (panels c and d). The coloured dots represent the star clusters analysed in this work. Yellow squares represent MCs clusters from Goudfrooij et al. (2014), blue squares clusters analysed by Correnti et al. (2014) and used by Goudfrooij et al. (2014) as a lower limit for the existence of the eMSTO, and YMCs analysed by Niederhofer et al. (2015) as yellow crosses. Yellow triangles show MWOCs from Cordoni et al. (2018). The yellow stars are the results by Piatti & Bastian (2016a,b). The colored dotted lines illustrate the expected MSTO width, comparing non-rotating isochrones with models for different rotation fractions - Ω/ΩC = 0.3 (blue), 0.6 (orange), 0.8 (green), and 0.99 (red) - adopting the metallicity of [M∕H]= −0.6 (the mean of our sample). The horizontal dashed blue line represents previous limits from Correnti et al. (2014) and Goudfrooij et al. (2014), while the pink line and shaded region mark the eMSTO limit derived in this work. The black lines in panels a and b represent the linear regression for the data from Cordoni et al. (2018, dotted), Goudfrooij et al. (2014, dashed), and this work (solid). The grey shaded regions represent the standard deviation of the fit. |
| In the text | |
|
Fig. A.1 CMD corrected by differential reddening of all the clusters in our sample. |
| In the text | |
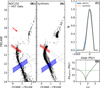 |
Fig. B.1 Same as Fig. 2 but for NGC 152 using HST data. |
| In the text | |
Current usage metrics show cumulative count of Article Views (full-text article views including HTML views, PDF and ePub downloads, according to the available data) and Abstracts Views on Vision4Press platform.
Data correspond to usage on the plateform after 2015. The current usage metrics is available 48-96 hours after online publication and is updated daily on week days.
Initial download of the metrics may take a while.