Fig. 3
Download original image
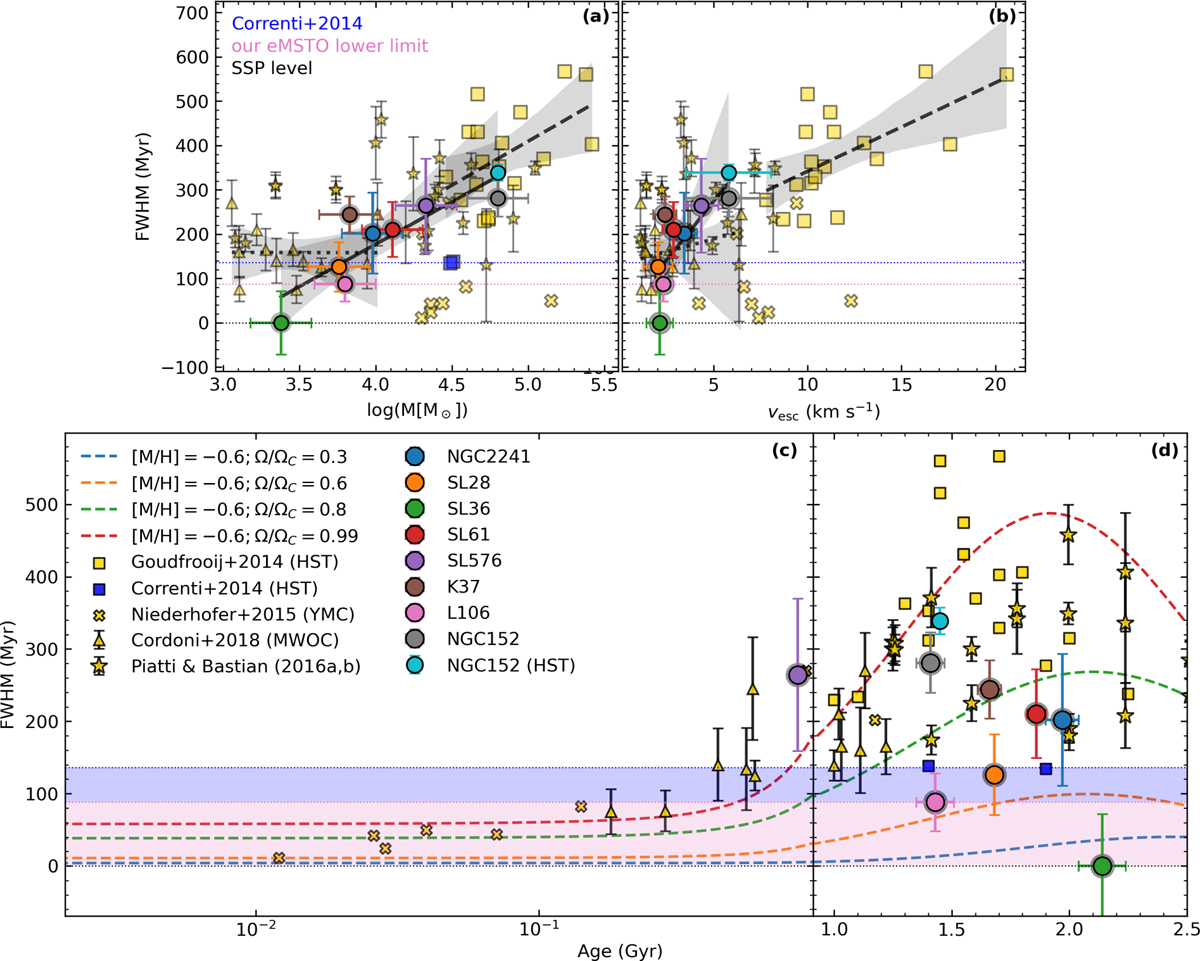
MSTO width at 50% of the maximum (FWHM) as a function of cluster mass (panel a), escape velocity (panel b), and age (panels c and d). The coloured dots represent the star clusters analysed in this work. Yellow squares represent MCs clusters from Goudfrooij et al. (2014), blue squares clusters analysed by Correnti et al. (2014) and used by Goudfrooij et al. (2014) as a lower limit for the existence of the eMSTO, and YMCs analysed by Niederhofer et al. (2015) as yellow crosses. Yellow triangles show MWOCs from Cordoni et al. (2018). The yellow stars are the results by Piatti & Bastian (2016a,b). The colored dotted lines illustrate the expected MSTO width, comparing non-rotating isochrones with models for different rotation fractions - Ω/ΩC = 0.3 (blue), 0.6 (orange), 0.8 (green), and 0.99 (red) - adopting the metallicity of [M∕H]= −0.6 (the mean of our sample). The horizontal dashed blue line represents previous limits from Correnti et al. (2014) and Goudfrooij et al. (2014), while the pink line and shaded region mark the eMSTO limit derived in this work. The black lines in panels a and b represent the linear regression for the data from Cordoni et al. (2018, dotted), Goudfrooij et al. (2014, dashed), and this work (solid). The grey shaded regions represent the standard deviation of the fit.
Current usage metrics show cumulative count of Article Views (full-text article views including HTML views, PDF and ePub downloads, according to the available data) and Abstracts Views on Vision4Press platform.
Data correspond to usage on the plateform after 2015. The current usage metrics is available 48-96 hours after online publication and is updated daily on week days.
Initial download of the metrics may take a while.