Open Access
Fig. 2.
Download original image
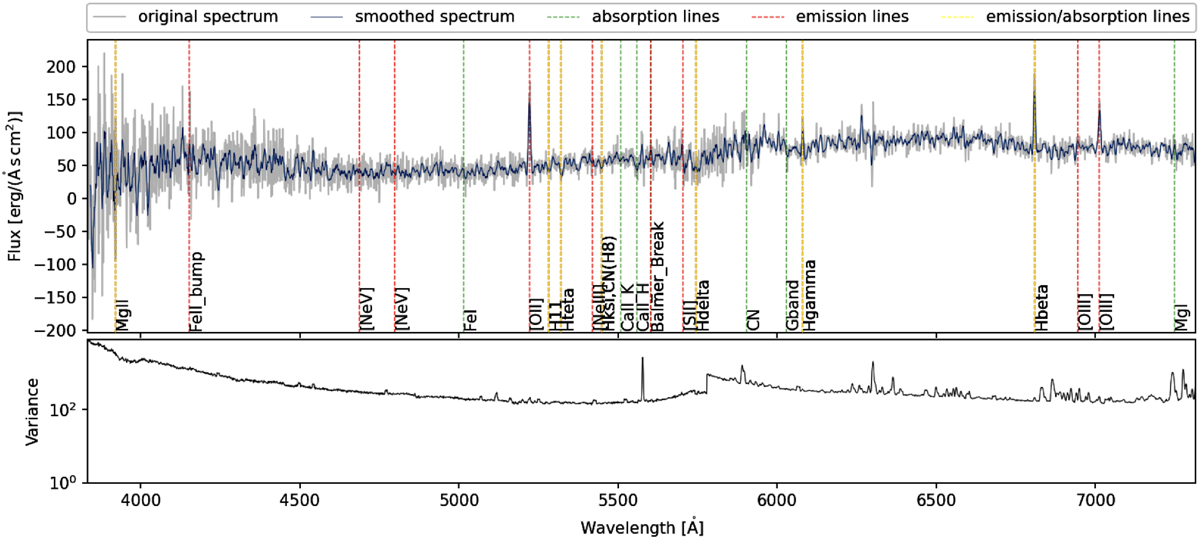
In the top panel is shown the spectrum of a galaxy from our AAOmega sample (ID: MACS64052446, z ∼ 0.40), with the z estimated via Redrock. The key emission and absorption lines are marked with coloured dashed lines (see legend at top). The variance of the spectrum is illustrated in the bottom panel.
Current usage metrics show cumulative count of Article Views (full-text article views including HTML views, PDF and ePub downloads, according to the available data) and Abstracts Views on Vision4Press platform.
Data correspond to usage on the plateform after 2015. The current usage metrics is available 48-96 hours after online publication and is updated daily on week days.
Initial download of the metrics may take a while.