Fig. 3.
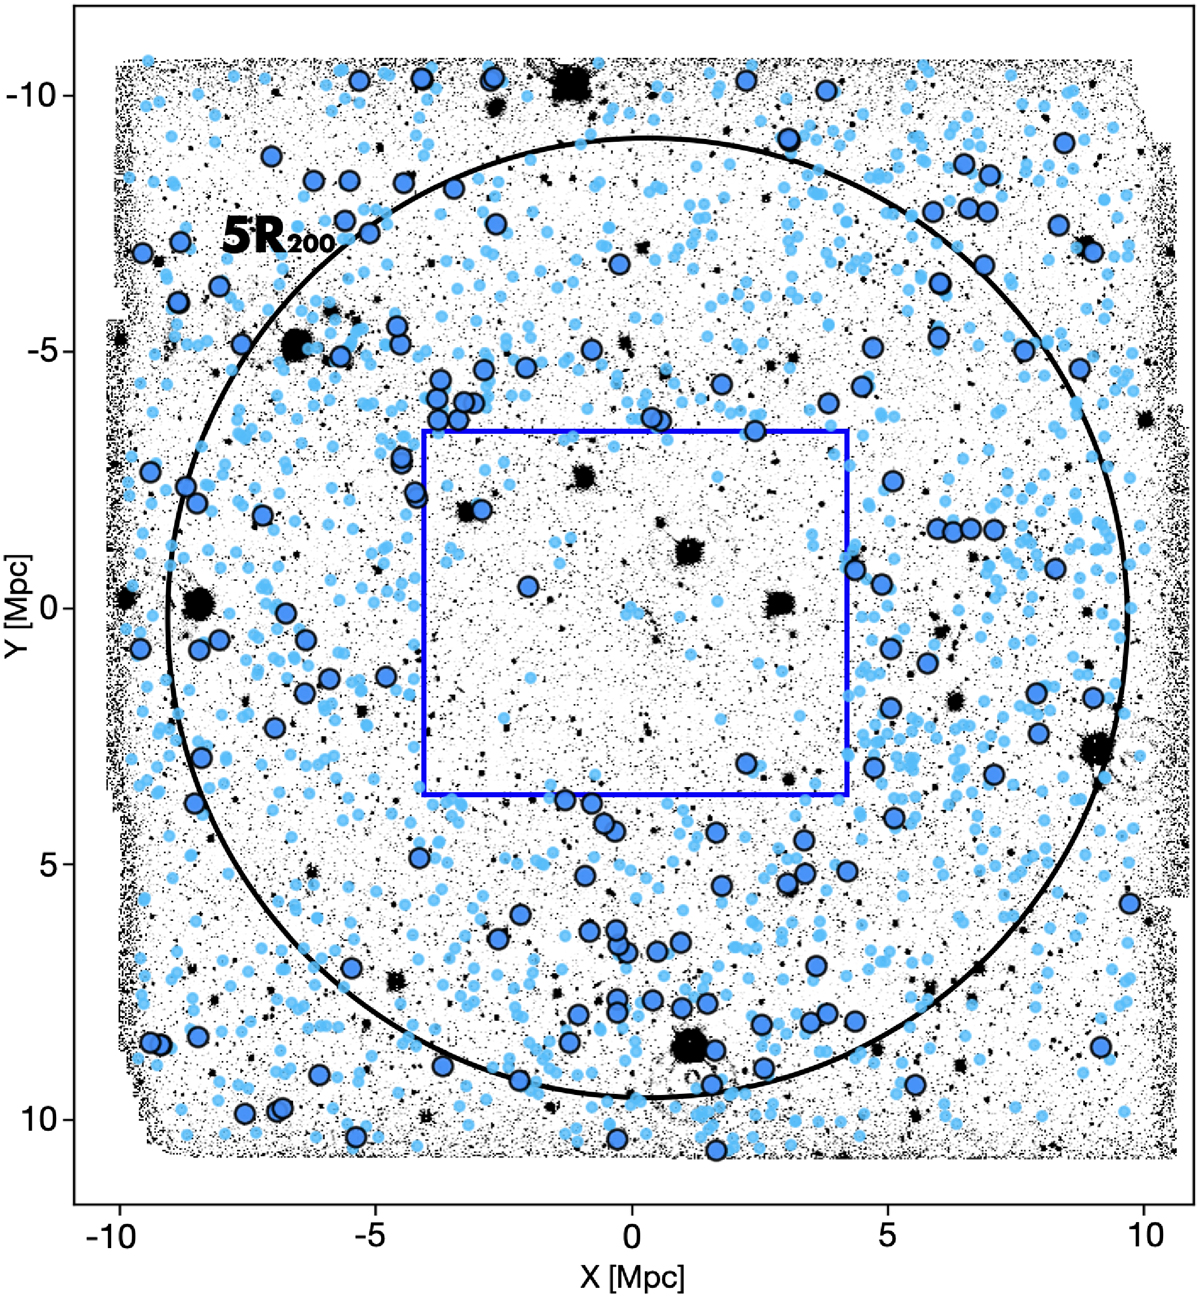
Download original image
VST i-band image covering 1 deg2 (∼20 × 20 Mpc2), overlapped with the 1236 AAOmega measured redshifts (turquoise points). The light blue circles with black edges represent the new 148 members of MACS0416 from AAOmega catalogue, in the redshift range z = [0.382 − 0.412]. The region where VIMOS or MUSE redshifts are available over z = [0.02 − 6.2] range is represented as a blue rectangle. The black circle corresponds to the radial distance from the cluster centre of 5R200 ∼ 9.1 Mpc.
Current usage metrics show cumulative count of Article Views (full-text article views including HTML views, PDF and ePub downloads, according to the available data) and Abstracts Views on Vision4Press platform.
Data correspond to usage on the plateform after 2015. The current usage metrics is available 48-96 hours after online publication and is updated daily on week days.
Initial download of the metrics may take a while.