Fig. 5.
Download original image
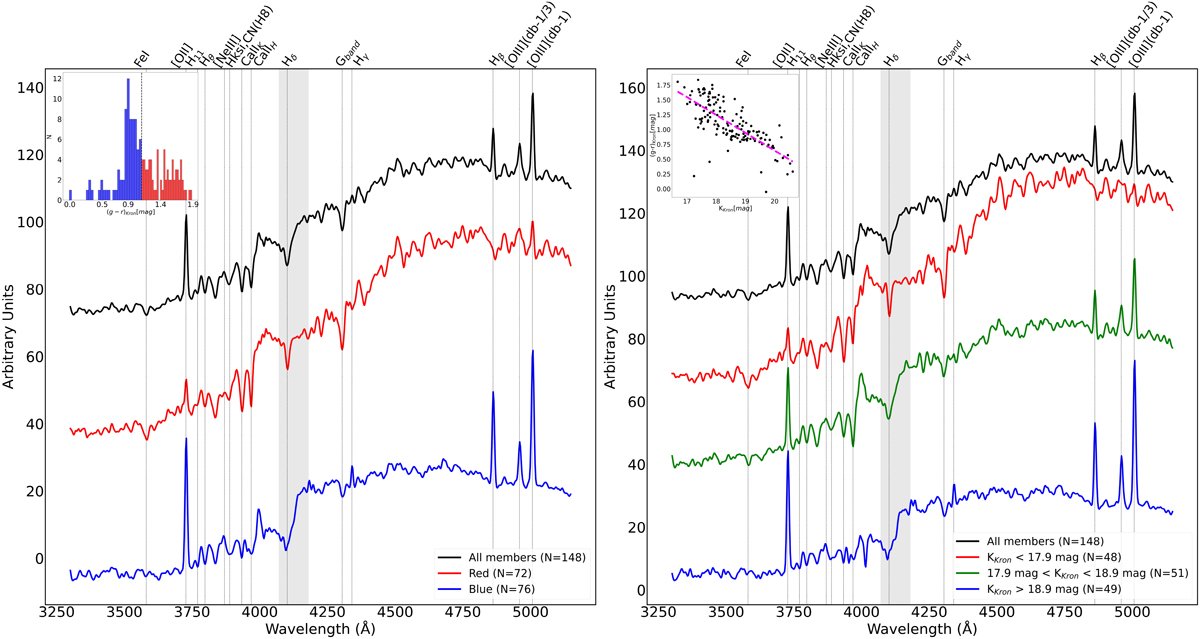
Average spectral properties of our sample as a function of colour and KKron as a proxy of the stellar mass. Left panel: Sample divided into red (72) and blue (76) galaxies, with their stacked spectra displayed in red and blue, respectively. A (g − r)Kron colour cut was used. The inset in the top left corner shows a colour distribution of our sample, where the x-axis represents the observed (g − r)Kron colour, corrected for extinction. Right panel: Whole sample divided into three subclasses based on the three bins of KKron. In red is the stacked spectrum of the brightest galaxies with KKron < 17.9 mag, in green that of the galaxies with intermediate luminosity 17.9 mag ≤ KKron < 18.9 mag, and in blue the stacked spectrum of the faint galaxies with KKron ≥ 18.9 mag. In the top left corner, an inset showing the trend between (g − r)Kron and KKron magnitude is reported. The dashed magenta line corresponds to the best fit of the linear correlation. In both panels, the stacked spectrum of the entire population of members (148) of MACS0416, obtained with AAOmega, is shown in black. All spectra are rest-frame and have been smoothed using a Gaussian kernel with a sigma of 2 pixels. The vertical dashed grey area corresponds to the spectral region of the join between the two arms.
Current usage metrics show cumulative count of Article Views (full-text article views including HTML views, PDF and ePub downloads, according to the available data) and Abstracts Views on Vision4Press platform.
Data correspond to usage on the plateform after 2015. The current usage metrics is available 48-96 hours after online publication and is updated daily on week days.
Initial download of the metrics may take a while.