Fig. 6.
Download original image
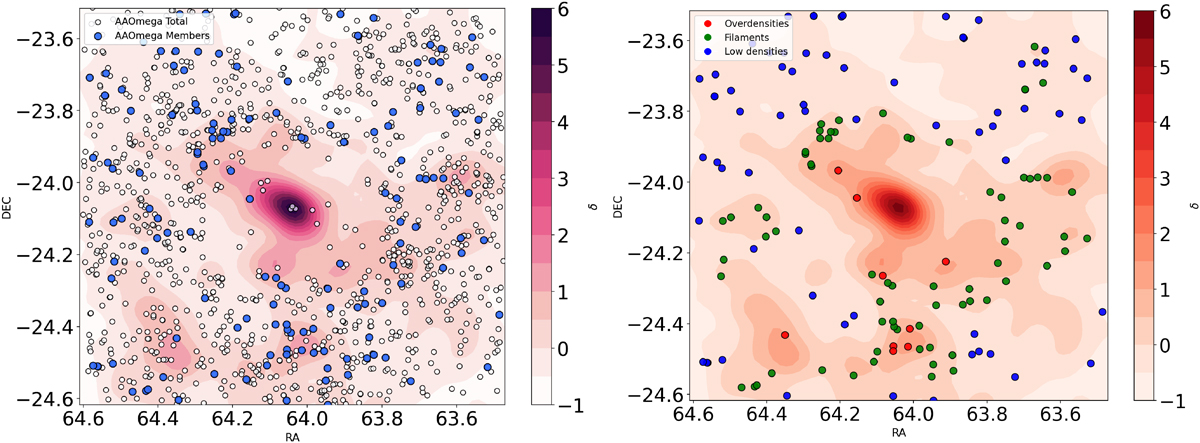
Left panel: Photometric density map of MACS0416 from Estrada et al. (2023), with all the new redshifts of objects with QF ≥ 2 (1236) obtained with AAOmega overlaid (white circles), highlighting the new spectroscopic cluster members (148) (light blue circles). Right panel: Same as left panel, with all the new spectroscopic cluster members (148) obtained with AAOmega overlaid, colour-coded as a function of δ. The red and green points are the members in the overdensities plus filamentary structures, while blue points are those in the underdense regions.
Current usage metrics show cumulative count of Article Views (full-text article views including HTML views, PDF and ePub downloads, according to the available data) and Abstracts Views on Vision4Press platform.
Data correspond to usage on the plateform after 2015. The current usage metrics is available 48-96 hours after online publication and is updated daily on week days.
Initial download of the metrics may take a while.