Fig. 7.
Download original image
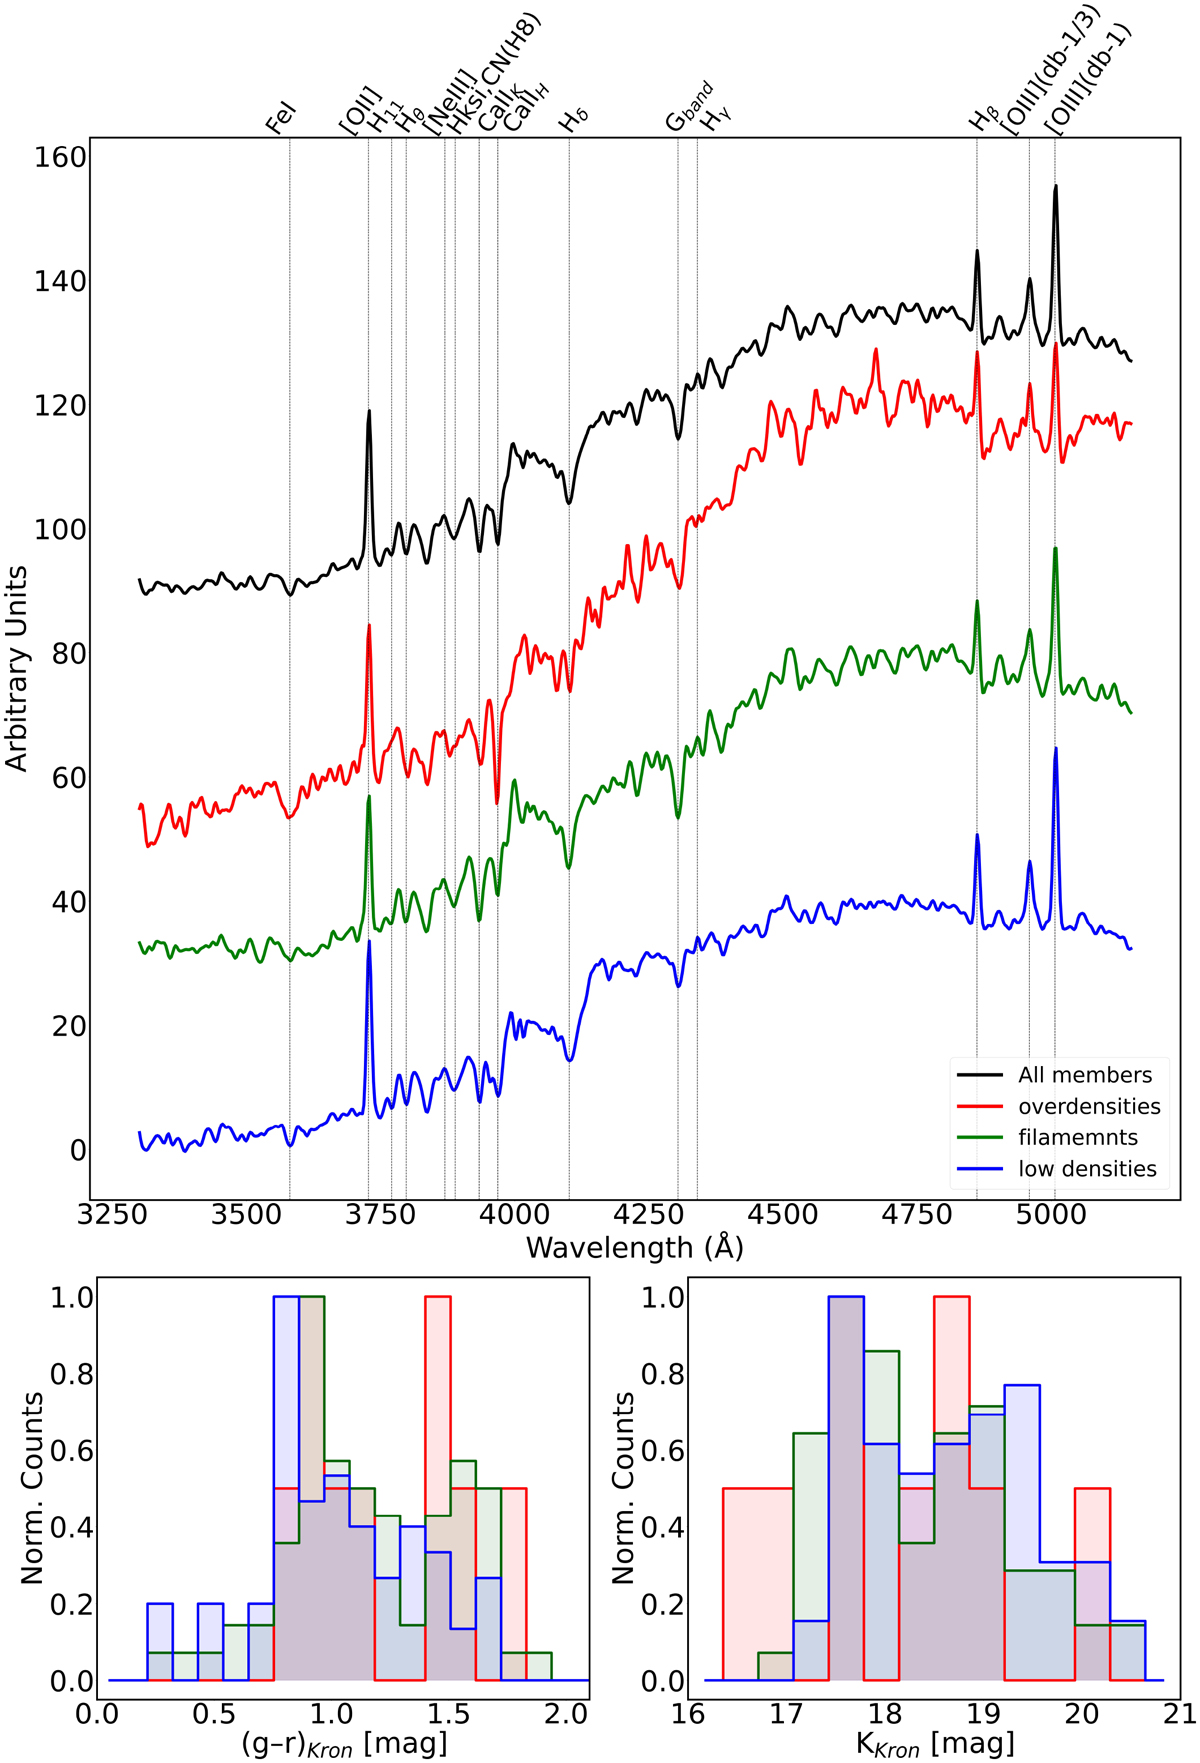
Average spectral properties of our sample as a function of the local environment. Top panel: Stacked spectrum of the AAOmega members (148) is shown in black. The stacked spectra of galaxies located in overdense regions are shown in red; those in filamentary regions in green; and those in less dense areas, comparable to the field, in blue. All spectra are rest-frame and have been smoothed using a Gaussian kernel with a sigma of 2 pixels. The vertical dashed grey area corresponds to the spectral region of the join between the two arms. Bottom panels: (g − r)Kron (left) and KKron (right) distributions of the galaxies in our sample as a function of the same three δ bins (red, green, and blue).
Current usage metrics show cumulative count of Article Views (full-text article views including HTML views, PDF and ePub downloads, according to the available data) and Abstracts Views on Vision4Press platform.
Data correspond to usage on the plateform after 2015. The current usage metrics is available 48-96 hours after online publication and is updated daily on week days.
Initial download of the metrics may take a while.