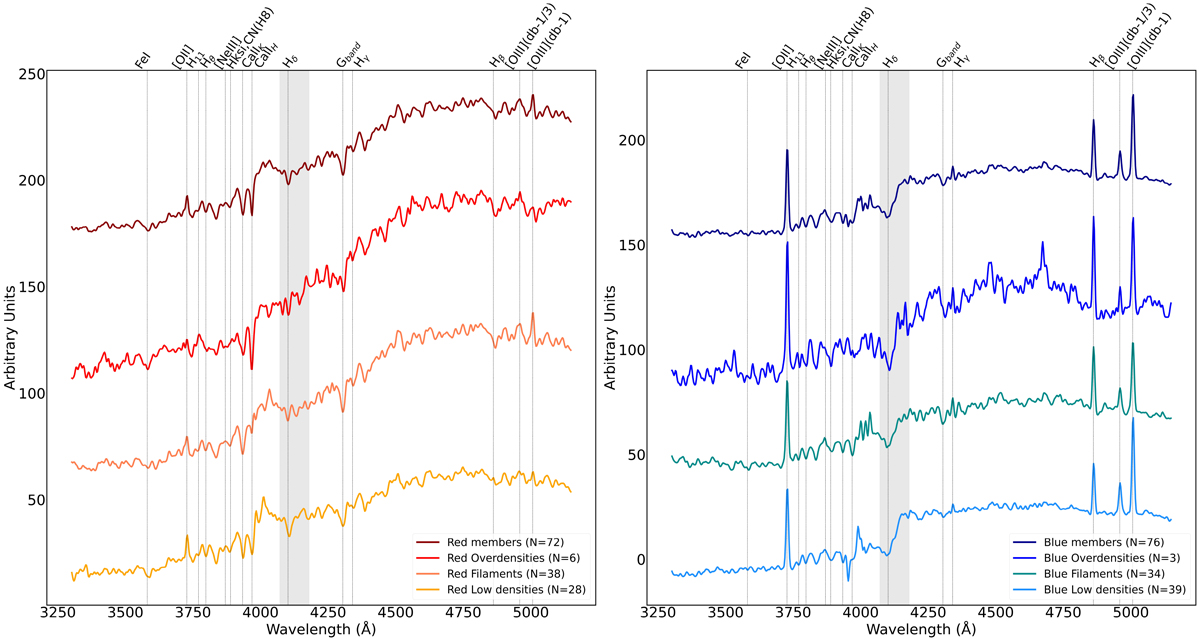
Fig. 8.
Download original image
Average spectral properties of our sample of red and blue galaxies as a function of the local environment. Left panel: Stacked spectrum of the population of red members (72) of MACS0416, is shown in dark red, at the top of the image. The entire sample was then divided into three subclasses based on the three bins of density δ. The stacked spectra of the red galaxies located in overdense regions are shown in red; those in filamentary regions in coral; and those in less dense areas, comparable to the field, in orange. Right panel: Same as the left panel, for the blue members (76) of MACS0416. All spectra are rest-frame and have been smoothed using a Gaussian kernel with a sigma of 2 pixels. The vertical dashed grey area corresponds to the spectral region of the join between the two arms. We performed a Kolmogorov–Smirnov (KS) test on each pair of average spectra in the left and the right panels, obtaining p-values much smaller than 0.05 (effectively consistent with zero), which strongly supports our assumption that the average spectra of the different populations are statistically distinct.
Current usage metrics show cumulative count of Article Views (full-text article views including HTML views, PDF and ePub downloads, according to the available data) and Abstracts Views on Vision4Press platform.
Data correspond to usage on the plateform after 2015. The current usage metrics is available 48-96 hours after online publication and is updated daily on week days.
Initial download of the metrics may take a while.