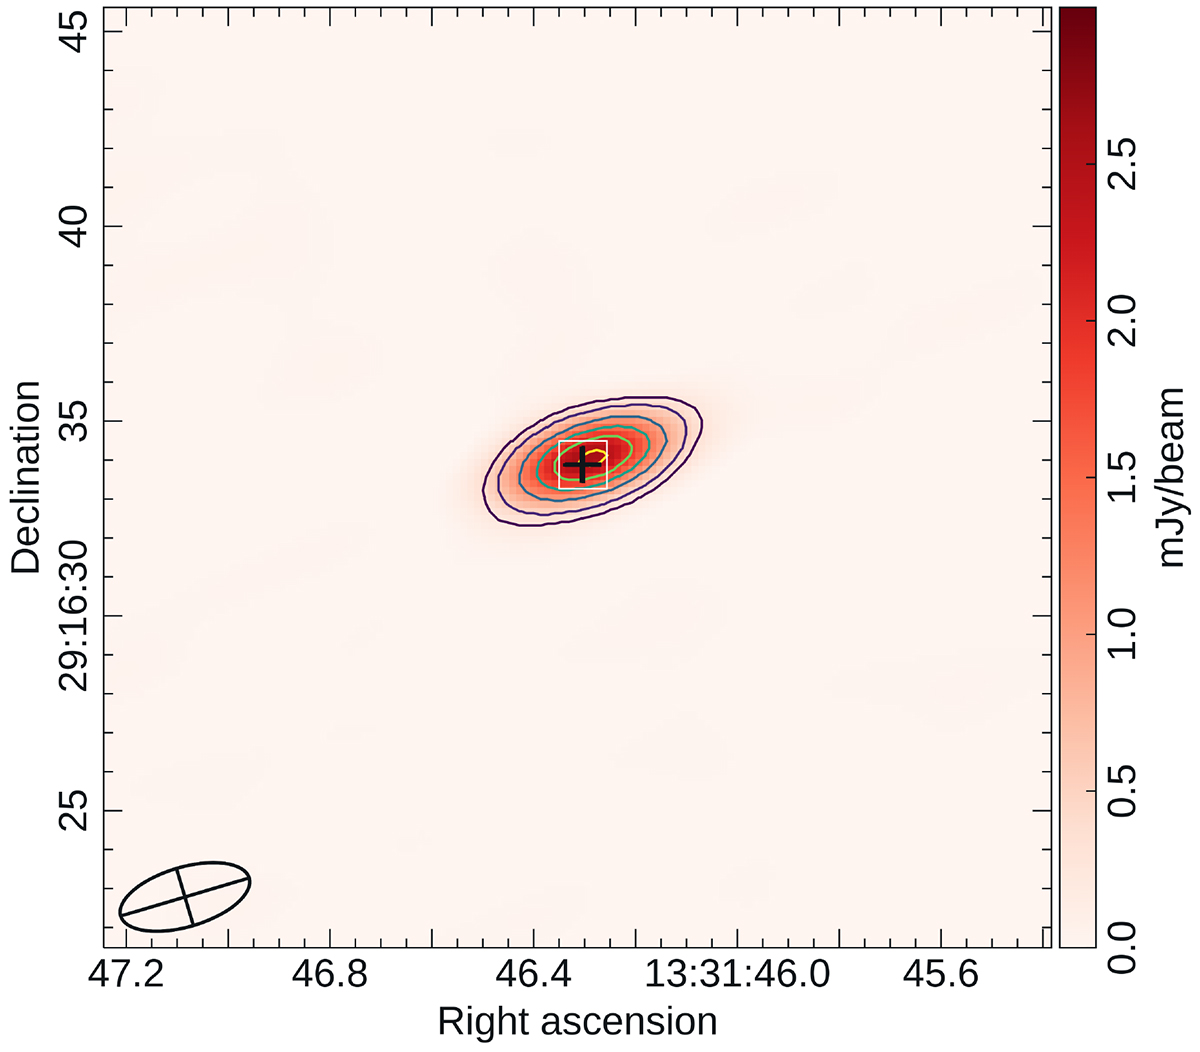
Fig. 1.
Download original image
Combined map for the January and February observations, centered at the emission peak, which shows an offset from the SIMBAD position that is compatible with the reported proper motion of DG CVn. The synthesized beam is shown in the lower left corner and the cross (+) marks the proper motion corrected position. The color scale represents the Stokes I flux density, while the contours indicate the Stokes V signal, corresponding to levels of 5, 10, 20, 30, 40, and 50 σrmsV (where σrmsV is ∼11.2 μJy/beam).
Current usage metrics show cumulative count of Article Views (full-text article views including HTML views, PDF and ePub downloads, according to the available data) and Abstracts Views on Vision4Press platform.
Data correspond to usage on the plateform after 2015. The current usage metrics is available 48-96 hours after online publication and is updated daily on week days.
Initial download of the metrics may take a while.