Fig. 2.
Download original image
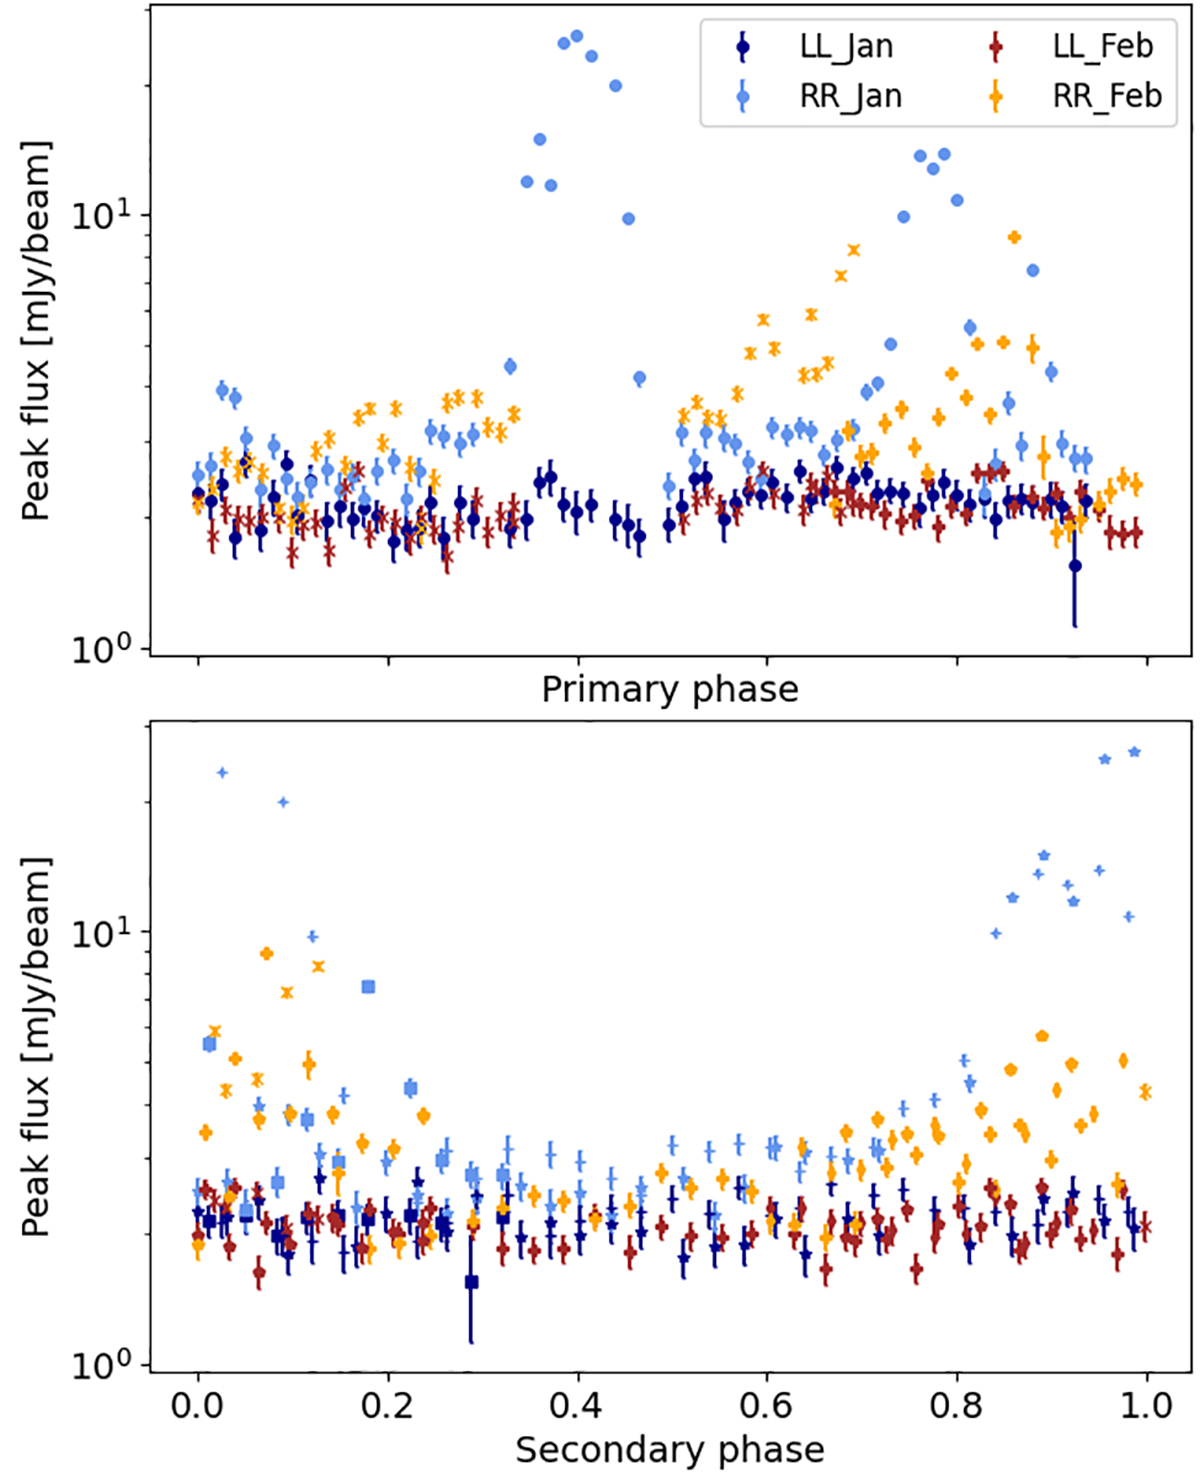
Phase-aligned light curves for LL and RR correlations using the primary period P1 = 6.44 h (top) and the secondary period P2 = 2.60 h (bottom), reported in Bouma et al. (2024). The flux represents the peak flux values on a logarithmic scale extracted from the image planes of each 5-minute scan, using the CASA task imfit. Here, phase ![]() (i.e., the starting phase for both periods) corresponds to the beginning of the first target scan of January observation (07:17:00 UT). Different symbols mark the different cycles covered during each observation. Note that the accuracy on the period is enough to guarantee phase linkage after ∼1 month, with an accuracy of ≲ a few percent, estimated by Eq. (9) of Bouma et al. (2024).
(i.e., the starting phase for both periods) corresponds to the beginning of the first target scan of January observation (07:17:00 UT). Different symbols mark the different cycles covered during each observation. Note that the accuracy on the period is enough to guarantee phase linkage after ∼1 month, with an accuracy of ≲ a few percent, estimated by Eq. (9) of Bouma et al. (2024).
Current usage metrics show cumulative count of Article Views (full-text article views including HTML views, PDF and ePub downloads, according to the available data) and Abstracts Views on Vision4Press platform.
Data correspond to usage on the plateform after 2015. The current usage metrics is available 48-96 hours after online publication and is updated daily on week days.
Initial download of the metrics may take a while.