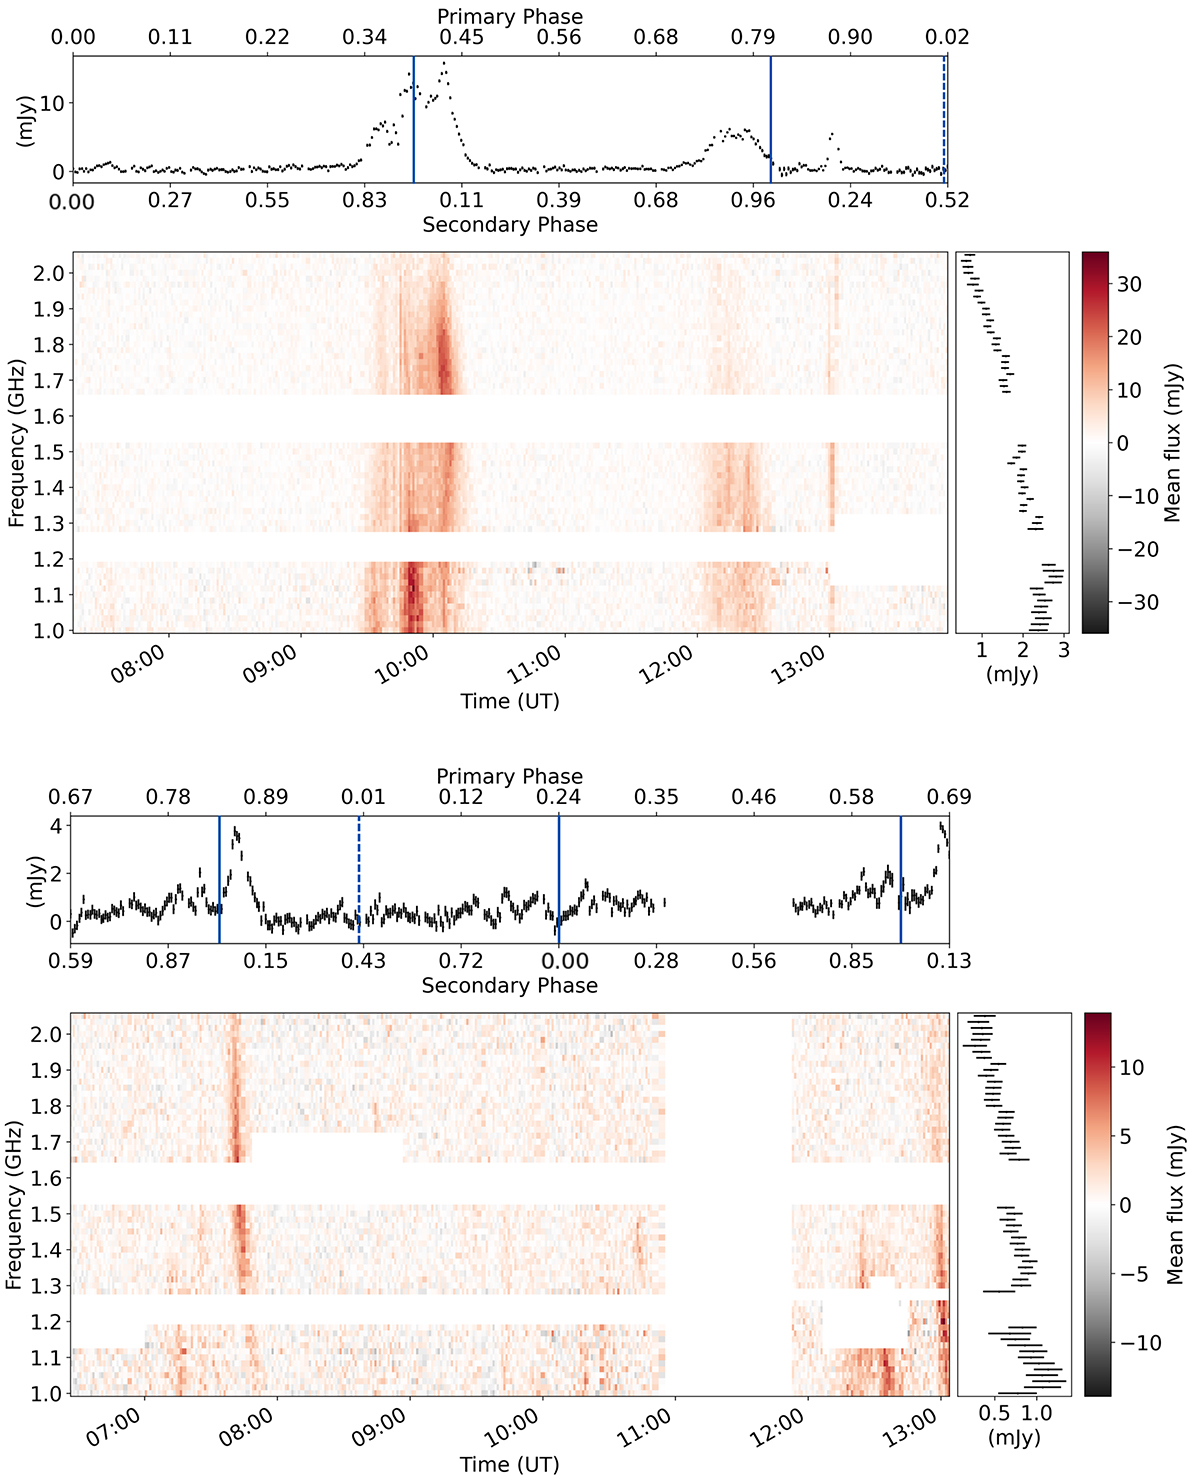
Fig. 3.
Download original image
Dynamic spectra for Stokes V for January (top) and February (bottom) observations, taken from visibility plane. The error bars in the light curves and frequency spectrum represent the standard deviation, computed by considering the imaginary component of the amplitude. The top and bottom axes of the top panel represent the primary and secondary phases (Φ1 and Φ2), respectively, calculated using the primary and secondary periods reported in Bouma et al. (2024). We fixed the reference phase Φ = 0 at the beginning of the first target scan in the January observation. The vertical blue lines indicate the start (Φ = 0) of new primary (dashed) and secondary (solid) cycles, respectively.
Current usage metrics show cumulative count of Article Views (full-text article views including HTML views, PDF and ePub downloads, according to the available data) and Abstracts Views on Vision4Press platform.
Data correspond to usage on the plateform after 2015. The current usage metrics is available 48-96 hours after online publication and is updated daily on week days.
Initial download of the metrics may take a while.