Open Access
Fig. 6
Download original image
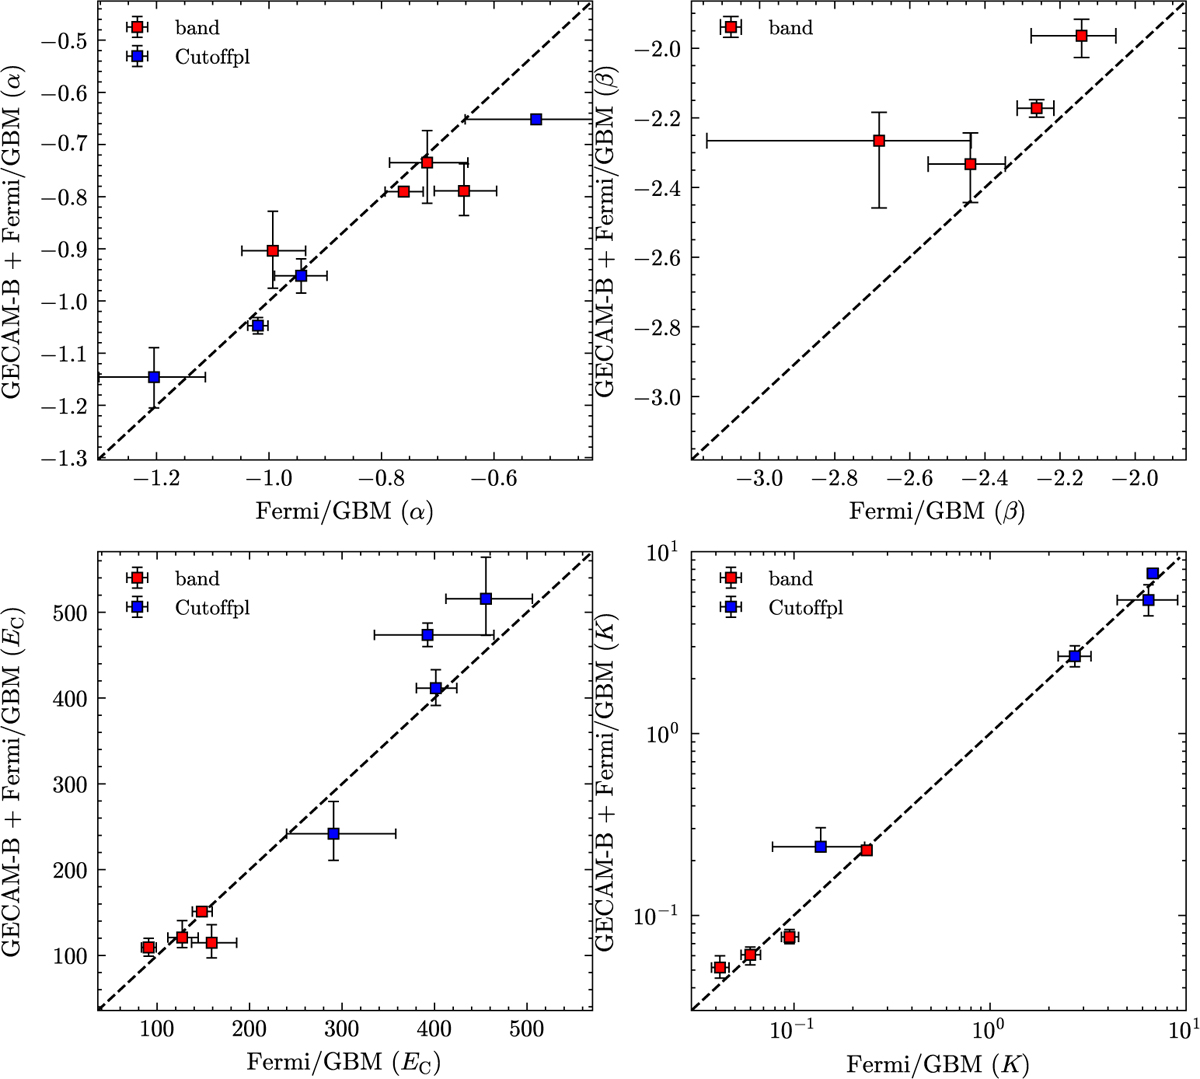
Comparison of spectral fitting results: Fermi/GBM only vs. joint Fermi/GBM and GECAM-B. The black dashed line denotes the one-to-one correlation. Different colors indicate different spectral models, and each data point corresponds to an individual GRB.
Current usage metrics show cumulative count of Article Views (full-text article views including HTML views, PDF and ePub downloads, according to the available data) and Abstracts Views on Vision4Press platform.
Data correspond to usage on the plateform after 2015. The current usage metrics is available 48-96 hours after online publication and is updated daily on week days.
Initial download of the metrics may take a while.