Fig. 11
Download original image
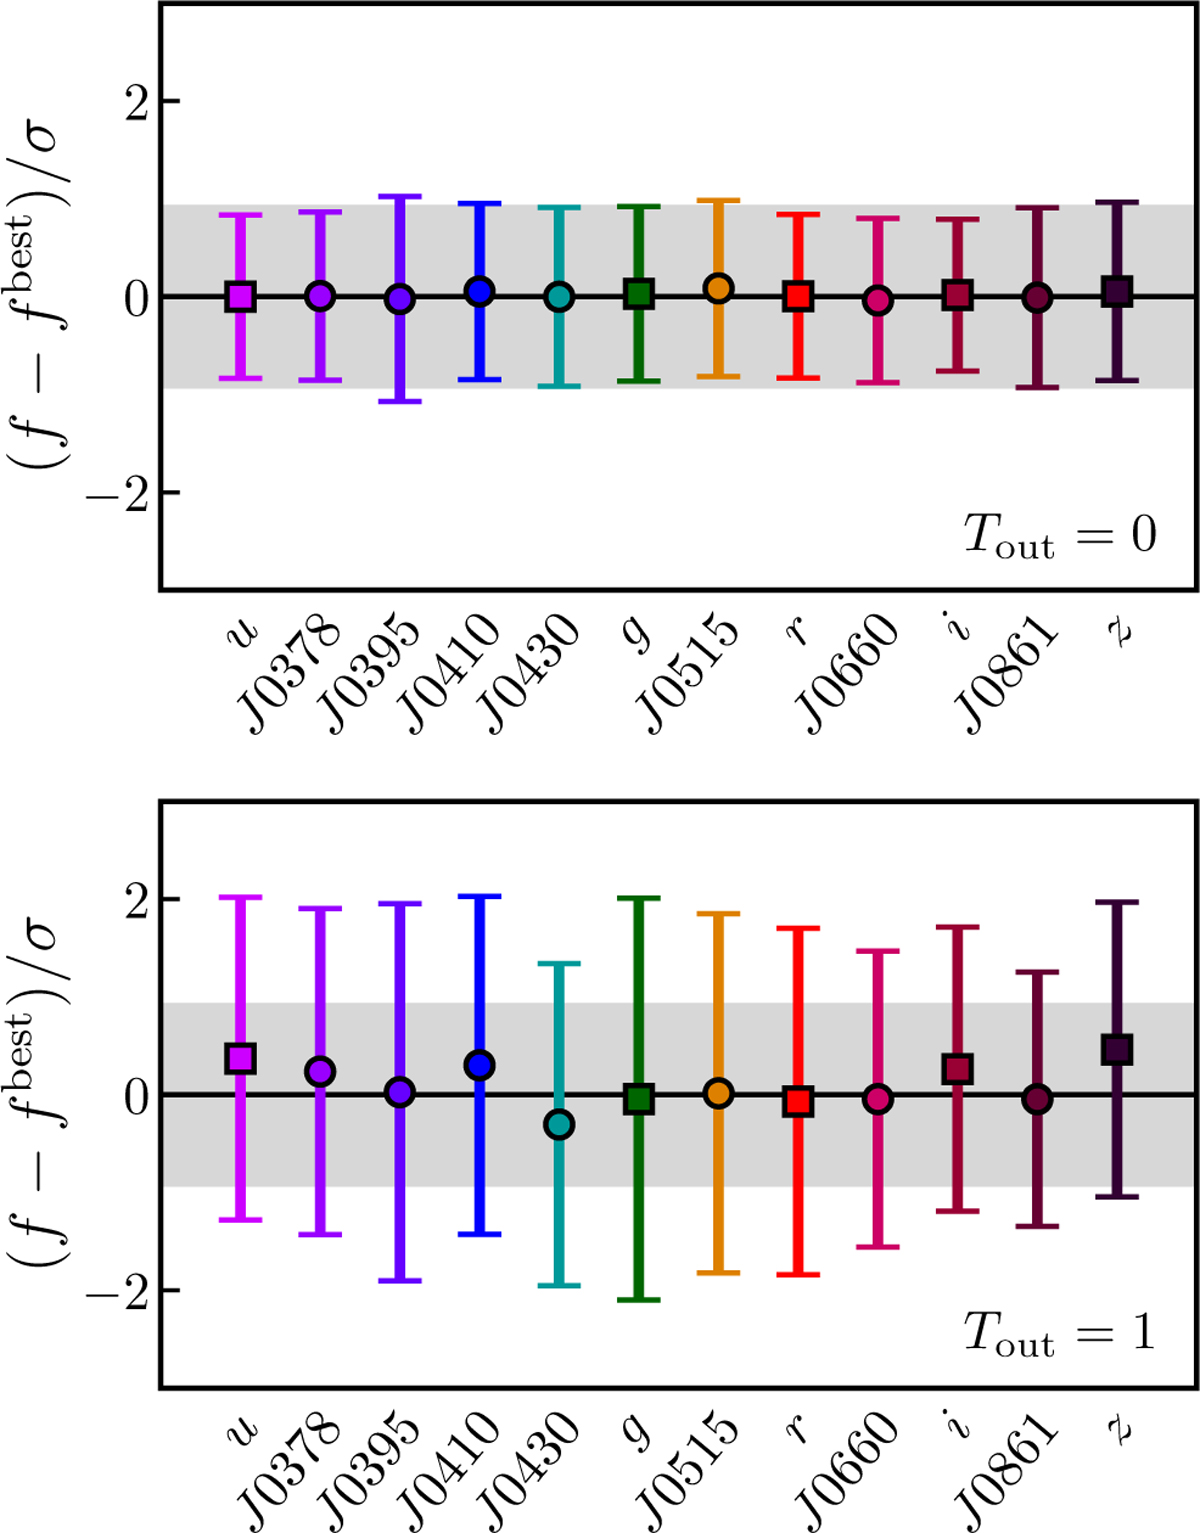
Normalized residuals for the different J-PLUS photometric bands, as labeled on the x-axis. The median and the dispersion of the best Gaussian describing the residuals of the population are shown with the symbols and the error bars, respectively. The solid black line depicts a zero difference, and the shaded region represents the expected range for a random distribution. The top panel corresponds to the outlier type Tout = 0 and the bottom panel to Tout = 1.
Current usage metrics show cumulative count of Article Views (full-text article views including HTML views, PDF and ePub downloads, according to the available data) and Abstracts Views on Vision4Press platform.
Data correspond to usage on the plateform after 2015. The current usage metrics is available 48-96 hours after online publication and is updated daily on week days.
Initial download of the metrics may take a while.