| Issue |
A&A
Volume 701, September 2025
|
|
|---|---|---|
| Article Number | A273 | |
| Number of page(s) | 18 | |
| Section | Catalogs and data | |
| DOI | https://doi.org/10.1051/0004-6361/202555286 | |
| Published online | 24 September 2025 | |
J-PLUS: Understanding outlier white dwarfs in the third data release via dimensionality reduction
1
Centro de Estudios de Física del Cosmos de Aragón (CEFCA),
Plaza San Juan 1,
44001
Teruel,
Spain
2
Unidad Asociada CEFCA-IAA, CEFCA, Unidad Asociada al CSIC por el IAA y el IFCA,
Plaza San Juan 1,
44001
Teruel,
Spain
3
Department of Physics, University of Warwick,
Coventry,
CV4 7AL,
UK
4
Instituto de Astrofísica de Andalucía, IAA-CSIC,
Glorieta de la Astronomía S/N,
18008
Granada,
Spain
5
Instituto de Física de Cantabria (IFCA, CSIC),
Avda. de los Castros s/n,
39005
Santander,
Spain
6
Centro de Astrobiología (CAB), CSIC-INTA,
Camino Bajo del Castillo s/n,
28692
Villanueva de la Cañada,
Madrid,
Spain
7
Departament de Física, Universitat Politècnica de Catalunya,
c/Esteve Terrades 5,
08860
Castelldefels,
Barcelona,
Spain
8
Institut d’Estudis Espacials de Catalunya,
Esteve Terradas, 1, Edifici RDIT, Campus PMT-UPC,
08860
Castelldefels,
Barcelona,
Spain
9
Observatório Nacional – MCTI (ON),
Rua Gal. José Cristino 77, São Cristóvão,
20921-400
Rio de Janeiro,
Brazil
10
Donostia International Physics Centre (DIPC),
Paseo Manuel de Lardizabal 4,
20018
Donostia-San Sebastián,
Spain
11
IKERBASQUE, Basque Foundation for Science,
48013
Bilbao,
Spain
12
University of Michigan, Department of Astronomy,
1085 South University Ave.,
Ann Arbor,
MI
48109,
USA
13
Instituto de Astrofísica de Canarias,
La Laguna,
38205,
Tenerife,
Spain
14
Departamento de Astrofísica, Universidad de La Laguna,
38206,
Tenerife,
Spain
15
Instituto de Astronomia, Geofísica e Ciências Atmosféricas, Universidade de São Paulo,
05508-090
São Paulo,
Brazil
★ Corresponding author: This email address is being protected from spambots. You need JavaScript enabled to view it.
Received:
24
April
2025
Accepted:
26
July
2025
Abstract
Aims. We present the white dwarf catalog derived from the third data release of the Javalambre Photometric Local Universe Survey (J-PLUS DR3), which covers 3284 deg2 using 12 optical filters. A particular focus is given to the classification of outlier sources, those largely incompatible with the theoretical models used in the analysis, through dimensionality reduction techniques.
Methods. We applied a Bayesian fitting process to the 12-band J-PLUS photometry of white dwarf candidates from Gaia EDR3. The derived parameters were effective temperature, surface gravity, and parallax. We used theoretical models from H- and He-dominated atmospheres, with priors applied to parallax and spectral type. From the posteriors, we derived the probability of an H-dominated atmosphere and of calcium absorption for each source. Outliers were identified as sources withχ2 ≥ 23.2, indicating significant deviations from the best-fitting model. We analyzed the residuals from the fits using the uniform manifold approximation and projection (UMAP) technique, which enables the classification of outliers into distinct categories.
Results. The catalog includes 14 844 white dwarfs with r ≤ 20 mag and 1 ≤ ϖ < 100 mas, with 72% of the sources lacking spectroscopic (R ≳ 500) classification. The application of UMAP to the residuals identified three main types of outliers: random measurement fluctuations (391 sources), metal-polluted white dwarfs (98 sources), and two-component systems (282 sources). The last category also includes white dwarfs with strong carbon absorption lines. We validated the reliability of J-PLUS classifications by comparison with spectroscopy from the Sloan Digital Sky Survey and the Dark Energy Spectroscopic Instrument, and with Gaia BP/RP low-resolution spectra, confirming a one-to-one correspondence between J-PLUS photometric and spectroscopic classifications.
Conclusions. The J-PLUS DR3 white dwarf catalog provides a robust dataset for statistical studies. The use of dimensionality reduction techniques enhances the identification of peculiar objects, making this catalog a valuable resource for the selection of interesting targets such as metal-polluted white dwarfs or binary systems.
Key words: methods: statistical / catalogs / white dwarfs
© The Authors 2025
 Open Access article, published by EDP Sciences, under the terms of the Creative Commons Attribution License (https://creativecommons.org/licenses/by/4.0), which permits unrestricted use, distribution, and reproduction in any medium, provided the original work is properly cited.
This article is published in open access under the Subscribe to Open model. This email address is being protected from spambots. You need JavaScript enabled to view it. to support open access publication.
1 Introduction
White dwarfs represent the final evolutionary stage of low-and intermediate-mass stars (M < 8–10 M⊙), making them key objects for understanding stellar evolution, the star formation history of the Milky Way, and advances in the physics of dense matter (e.g. Isern et al. 2022). The Gaia mission (Gaia Collaboration 2016) has revolutionized the study of white dwarfs (Tremblay et al. 2024). The Gaia second data release (DR2; Gaia Collaboration 2018) marked a major breakthrough by identifying above 200 000 white dwarf candidates (Jiménez-Esteban et al. 2018; Gentile Fusillo et al. 2019), while Gaia early data release three (EDR3; Gaia Collaboration 2021a) further refined these selections and expanded the dataset, which now contains approximately 360 000 candidates with precise astrometry and photometry (Gentile Fusillo et al. 2021, here-after GF21). The Gaia data enable the construction of volume-limited samples (e.g., Hollands et al. 2018; Gaia Collaboration 2021b; Jiménez-Esteban et al. 2023; O’Brien et al. 2024; Kilic et al. 2025), minimizing selection biases and allowing robust statistical analyses of the white dwarf population.
Although photometric and astrometric data from Gaia provide valuable information, spectroscopic follow-up remains essential to further characterize their atmospheric properties. Before Gaia, the Sloan Digital Sky Survey (SDSS; Abdurro’uf et al. 2022) played a crucial role in building spectroscopic catalogs of white dwarfs, providing thousands of high-quality spectra (e.g., Eisenstein et al. 2006; Kepler et al. 2019; GF21). More recently, dedicated spectroscopic efforts have resulted in highly complete catalogs, such as the 40 pc sample (Limoges et al. 2015; Tremblay et al. 2020; McCleery et al. 2020; O’Brien et al. 2023, 2024) and the 100 pc sample (Kilic et al. 2020, 2025). Currently, massive spectroscopic follow-ups of the Gaia-based samples are ongoing or planned with the SDSS-V Milky Way Mapper (Kollmeier et al. 2017), the William Herschel Telescope Enhanced Area Velocity Explorer (WEAVE, Jin et al. 2024), the Dark Energy Spectroscopic Instrument (DESI, Allende Prieto et al. 2020; Manser et al. 2024), and the 4-meter Multi-Object Spectrograph Telescope (4MOST, Chiappini et al. 2019). These surveys collectively aim to observe over 250 000 white dwarfs spectroscopically, providing precise atmospheric parameters and composition. Additionally, the low-resolution blue photometer and red photometer (BP/RP) spectra from Gaia DR3 (De Angeli et al. 2023; Montegriffo et al. 2023) also permit white dwarf classification and atmospheric characterization, further expanding the potential for statistical studies of the white dwarf population (e.g., Jiménez-Esteban et al. 2023; Torres et al. 2023; García-Zamora et al. 2023; Vincent et al. 2024; Pérez-Couto et al. 2024).
Another valuable complement to Gaia’s catalogs of white dwarfs comes from large-area multi-filter photometric surveys, which provide deeper observations over thousands of square degrees and enable the construction of spectral energy distributions (SEDs) without requiring any additional spectroscopic preselection. The most relevant projects in this context are the Javalambre Photometric Local Universe Survey1 (J-PLUS, with 12 optical filters; Cenarro et al. 2019, Table 1), the Southern Photometric Local Universe Survey2 (S-PLUS, with the same filter system as J-PLUS; Mendes de Oliveira et al. 2019), and the Javalambre Physics of the Accelerating Universe Astrophysical Survey3 (J-PAS, with 56 narrow-band filters of 14.5 nm width and continuous coverage from 350 to 930 nm; Benítez et al. 2014; Bonoli et al. 2021). Using its multi-filter photometric coverage, J-PLUS has already contributed significant results, such as constraining the spectral evolution of white dwarfs (López-Sanjuan et al. 2022a) and determining the fraction of calcium-polluted white dwarfs along the cooling sequence (López-Sanjuan et al. 2024a).
Access to tens of thousands of white dwarfs with photometric and spectroscopic data has also led to advances in the automation of analysis processes, including the use of machine learning techniques. Notable examples in the white dwarf field include the use of neural networks for the spectral classification of 36 500 SDSS spectra (Vincent et al. 2023, 2025) or the classification using the coefficients of the BP/RP low-resolution spectra from Gaia DR3 (García-Zamora et al. 2023, 2025; Vincent et al. 2024). Dimensionality reduction techniques have also been implemented to study Gaia’s BP/RP spectra (Kao et al. 2024; Pérez-Couto et al. 2024, 2025) and the medium-resolution spectra from DESIEDR (Byrne et al. 2024). In this context, machine learning tools allow the selection and characterization of outliers and anomalous objects in large databases. Examples include self-organizing maps in Gaia (Fustes et al. 2013), the analysis of SDSS spectra (Baron & Poznanski 2017; Vincent et al. 2025), artificial neural networks directly applied to images (e.g., Margalef-Bentabol et al. 2020; Storey-Fisher et al. 2021; Tanaka et al. 2022), automatic anomaly detection in time series (e.g., Malanchev et al. 2021; Muthukrishna et al. 2022), photometric redshifts (Singal et al. 2022; Dennis et al. 2025) or radio observations (Mesarcik et al. 2023), and general methodologies applicable to any type of astronomical data (e.g., ASTRONOMALY; Lochner & Bassett 2021).
This work presents the white dwarf catalog based on J-PLUS DR3, as a complement to the Gaia catalog by GF21. The catalog includes atmospheric parameters (effective temperature, surface gravity), composition (H-dominated, He-dominated, presence of polluting metals), and derived properties (mass, dust de-reddened r–band magnitude) for 14 844 white dwarfs, obtained with Bayesian SED-fitting techniques. The methodologies developed in previous studies (López-Sanjuan et al. 2022a, 2024a) are complemented by a novel analysis of outlier sources, defined as those largely incompatible with the theoretical models used in the fitting process. To achieve this, we applied the uniform manifold approximation and projection4 (UMAP; McInnes et al. 2018) dimensionality reduction technique to the residuals of the best-fitting model across the 12 J-PLUS bands, allowing the classification of outliers into different categories. The J-PLUS DR3 white dwarf catalog will be the starting point for future statistical analysis.
This paper is organized as follows. In Sect. 2, we describe the J-PLUS DR3 photometric data and the reference white dwarf catalog from GF21 used in our analysis. We present the methodology for obtaining atmospheric parameters, composition, and physical properties of the analyzed white dwarfs in Sect. 3. Sect. 4 details the analysis of outliers using dimensionality reduction techniques. A comparison of the J-PLUS classification with previous studies is discussed in Sect. 5. Finally, the conclusions are provided in Sect. 6. Magnitudes are expressed in the AB system (Oke & Gunn 1983).
J-PLUS photometric system.
2 Data
2.1 J-PLUS photometric data
J-PLUS is being carried out at the Observatorio Astrofísico de Javalambre (OAJ, Teruel, Spain; Cenarro et al. 2014) using the 83 cm Javalambre Auxiliary Survey Telescope (JAST80) and T80Cam, a wide-field camera with a resolution of 9.2k × 9.2k pixels, offering a 2 deg2 field of view and a pixel scale of 0.55 arcsec pix−1 (Marín-Franch et al. 2015). The survey employs a system of 12 optical passbands (Table 1), designed for precise stellar classification and studies in the nearby Universe. Details on the observational strategy, data reduction, and scientific objectives of J-PLUS are described in Cenarro et al. (2019).
The J-PLUS DR3 dataset includes 1642 pointings, corresponding to 3284 deg2. The limiting magnitudes (5σ, 3 arcsec aperture) in DR3 reach around 22.5 mag in the ɡ and r bands and 21.5 mag in the remaining ten filters. The median full width at half maximum (FWHM) of the point spread function (PSF) in the r band is 1.1 arcsec. We performed source extraction using the r band images with SExtractor (Bertin & Arnouts 1996), and flux measurements in all 12 bands were obtained at the pre-defined source positions based on the r band detections. Regions affected by image borders, bright stars, or optical artifacts were masked from the initial area, yielding a final high-quality area of 2881 deg2. The J-PLUS DR3 is publicly accessible through the J-PLUS website5.
We performed aperture photometry using a 3 arcsec diameter to study the white dwarf population. The measured fluxes were stored in the vector f = {fj}, while their associated uncertainties were recorded in the vector σf = {σj}, where the index j corresponds to the J-PLUS passbands. The error estimates include contributions from photon noise, sky background fluctuations, and uncertainties in the photometric calibration (López-Sanjuan et al. 2024b).
2.2 Gaia white dwarf catalog
The Gaia-based catalog of white dwarfs presented in GF21 was used as a reference. The selection of the GF21 catalog can be summarized as follows: 1280 266 objects were selected using their location on the color absolute magnitude diagram of Gaia EDR3 and after applying quality flags. The SDSS DR 16 (Ahumada et al. 2020) spectroscopic information for 22 998 white dwarfs and 7124 contaminants (main-sequence stars, sub-dwarfs, and quasars) was used to estimate the white dwarf probability, PWD, for each source in the initial sample. We refer the reader to GF21 for a detailed description of the selection criteria and the properties of the reference white dwarf sample.
The 359 073 sources with PWD > 0.75 in the GF21 catalog were cross-matched with J-PLUS DR3 using a 1.5 arcsec radius. A total of 19 581 sources with r ≤ 20.5 mag were found in common. The imposed magnitude limit ensures a well-defined volume and magnitude selection in the final white dwarf sample, as detailed in Sect. 3.4.
2.3 Ancillary data
At various stages, the visual and machine learning spectroscopic classification available at the Montreal White Dwarf Database6 (MWDD; Dufour et al. 2017) and the SIMBAD astronomical database7 (Wenger et al. 2000) were used. Following the classification of Sion et al. (1983), the main white dwarf spectral types considered in this work include those exhibiting hydrogen lines (DA), He II lines (DO), He I lines (DB), metal lines (DZ), carbon lines (DQ), featureless spectra (DC), magnetic fields (DH), and a main-sequence companion (WDMS).
3 J-PLUS DR3 white dwarf catalog
The methodology employed in the estimation of white dwarf atmospheric parameters and composition using a Bayesian framework is fully described in López-Sanjuan et al. (2022a, 2024a). The key aspects covered include the estimation of the likelihood and the assumed prior information, as summarized in the following sections. Representative examples of the analyzed white dwarfs are presented in Fig. 1.
3.1 Likelihood
The likelihood quantifies the probability of obtaining the fluxes observed in a 3-arcsec aperture by J-PLUS under the assumption of a particular model. The absolute model fluxes were derived from theoretical white dwarf atmosphere models, which depend on the effective temperature (Teff) and surface gravity (log g). These absolute model fluxes were converted to apparent fluxes with the parallax, which was used as an additional free parameter in the fitting process, the interstellar extinction, and the aperture corrections that translate total fluxes to 3-arcsec apertures8. The theoretical fluxes were then compared with the observed photo-metric measurements in the 12 J-PLUS passbands, weighted by their Gaussian uncertainties.
The extinction correction was updated with respect to López-Sanjuan et al. (2022a) and is based on the 3D extinction map of Edenhofer et al. (2024), which builds on the stellar distances and extinctions provided by Zhang et al. (2023). A Bayesian approach was employed, modeling interstellar extinction for 54 million nearby stars as a function of distance and incorporating a Gaussian-process prior methodology to mitigate fingers-of-God artifacts. We obtained the integrated median value of the extinction parameter E at white dwarf location for each parallax (i.e., distance) using the dustmaps9 program (Green 2018). The extinction coefficient10 for filter X, denoted RX, was estimated with the star-pair technique described in Yuan et al. (2013) applied to J-PLUS DR1 data. The J-PLUS extinction coefficients were found to be compatible with the extinction curve derived by Zhang et al. (2023) after applying a factor 0.965 (Fig. 2). Therefore, the extinction for each white dwarf in the fitting process was estimated as 0.965 RX × E (ϖ). Finally, the 3D map provided by Edenhofer et al. (2024) covers the 69–1250 pc range. The integrated extinction E at d < 69 pc was considered equal to zero, and our final sample is limited to a distance of 1 kpc (Sect. 3.4).
We investigated two atmospheric compositions, denoted as t, corresponding to H- and He-dominated atmospheres. Hydrogen-dominated atmospheres were modeled using pure-H configurations (t = H, Tremblay et al. 2011, 2013). In contrast, He-dominated atmospheres were described with mixed models, assuming an H/He ratio of 10−5 for Teff > 6500 K, and pure-He models for Teff < 6500 K (t = He, Cukanovaite et al. 2018, 2019). The use of mixed models for He-dominated atmospheres is motivated by observational evidence indicating the need for an additional electron donor in helium atmospheres to reconcile the mass distributions of H- and He-dominated white dwarfs (Bergeron et al. 2019). From a modeling perspective, adopting an H/He ratio of 10−5 serves as a suitable ansatz. The leading physical candidate for the additional donor is dredged-up carbon, although its abundance is expected to be too low to produce detectable features in optical spectra (Camisassa et al. 2023; Blouin et al. 2023a,b). The mass-radius relation from Fontaine et al. (2001) was adopted, considering thin hydrogen layers for helium atmospheres and thick hydrogen layers for H-dominated atmospheres. A detailed discussion of these models can be found in, e.g., Bergeron et al. (2019); Gentile Fusillo et al. (2020); McCleery et al. (2020).
3.2 Priors
We assumed a prior in the parallax:
 (1)
(1)
where ϖEDR3 is the Gaia EDR3 parallax (Gaia Collaboration 2021a) corrected by systematic offsets following Lindegren et al. (2021), σϖ is the error in the parallax, and PG depicts a Gaussian probability function.
A prior in the atmospheric composition was also applied, providing the probability of a white dwarf having an H-dominated atmosphere at a given Teff as
 (2)
(2)
where ƒHe (Teff) is the fraction of He-dominated white dwarfs derived by López-Sanjuan et al. (2022a) using J-PLUS DR2,
 (3)
(3)
imposing a minimum value of 0.08. The spectral evolution from López-Sanjuan et al. (2022a) is in good agreement with previous estimations; however, new measurements have become available since the publication of their results (see Bédard 2024 for a review). For example, the comparison with Torres et al. (2023), based on Gaia DR3 BP/RP spectra, and with Kilic et al. (2025), based on the 100 pc spectroscopic sample, is presented in Fig. 3. A remarkable agreement is found, reinforcing the results from J-PLUS DR2 and further justifying the assumed prior.
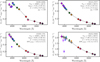 |
Fig. 1 Spectral energy distributions of four white dwarfs analyzed in this work. The colored points in all panels represent the J-PLUS 3-arcsec-diameter photometry, corrected for aperture effects. Broad-band filters (u, ɡ, r, i, z) are shown as squares, whereas narrow- and medium-band filters (J0378, J0395, J0410, J0430, J0515, J0660, J0861) are shown as circles. The best-fitting solution is indicated gray diamonds connected with a solid line, with the derived parameters and their uncertainties labeled in the panels: effective temperature (Teff), surface gravity (log g), and parallax (ϖ). The unique J-PLUS identification, composed of the TILE_ID of the reference r-band image and the NUMBER assigned by SExtractor to the source, is also reported in the panels for reference. Top panels: all passbands were used in the SED-fitting process, and the probability of having an H-dominated atmosphere (pH) is provided. Bottom panels: the equivalent width in the J0395 (EWJ0395) was computed to identify the presence of calcium absorption, using the expected continuum from the SED-fitting to the other eleven passbands (white diamond) as reference. These two sources have a probability of calcium absorption of pCa = 1. |
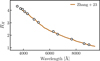 |
Fig. 2 Extinction coefficients of the J-PLUS passbands scaled by 0.965 (circles). The solid line depicts the extinction curve derived by Zhang et al. (2023) in the optical range. |
3.3 Posterior parameters and derived quantities
We combined the likelihood and the priors using Bayes’ theorem to obtain the posterior distribution functions (PDFs) of the parameters θ = {Teff, log g, ϖ} for two compositions t = {H, He}.
The point estimates of the parameters and their uncertainties were obtained with a Gaussian fit to the PDFs. The probability of having an H-dominated atmosphere was estimated as
 (4)
(4)
and the probability of being He-dominated is pHe = 1 − pH. Derived quantities, such as the stellar mass (M), the total r band apparent magnitude corrected for dust extinction ( ), or the effective volume accessible for each white dwarf given the selection of the sample (Veff), where estimated as the PDF-weighted solutions from the models.
The probability of presenting calcium absorption (pCa) was also estimated as an additional diagnostic, independent of the H- or He-dominated atmosphere classification, following López-Sanjuan et al. (2024a). In this case, we applied the same Bayesian SED fit process, but the J0395 passband, which is sensitive to calcium absorption, was excluded from the analysis. The modeling provided the continuum level in the absence of polluting metals, which we then compared with the observed flux to measure the equivalent width EWJ0395 and its uncertainty. The equivalent-width distribution was modeled to obtain the fraction of calcium white dwarfs as a function of Teff,
 (5)
(5)
imposing a minimum value of 0.01 and a maximum of 1. We used this evolution as a prior to properly weight the significance of EWJ0395 and provide pCa. We refer the reader to López-Sanjuan et al. (2024a) for an extensive discussion, including the selection and confirmation of new metal-polluted white dwarfs.
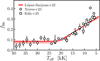 |
Fig. 3 Fraction of He-dominated white dwarfs (ƒHe) as a function of effective temperature (Teff). The solid red line represents the result from López-Sanjuan et al. (2022a) and corresponds to the prior used in Sect. 3.2. Measurements from Torres et al. (2023), using Gaia BP/RP spectra (hexagons), and from Kilic et al. (2025), using the 100 pc spectroscopic sample (squares), are also shown. |
3.4 Final sample
We analyzed the 19 581 sources with r ≤ 20.5 mag in common with the GF21 white dwarf catalog following the methodology described in previous sections. A selection with  < 20 mag and 1 ≤ ϖ < 100 mas was then applied to the posterior in the variables, ensuring a well-defined selection function, and only sources with a selection probability psel ≥ 0.01 within these limits were kept in the final catalog. This reduced the sample to 14 844 white dwarfs, corresponding to a psel-weighted number of 13 070.86 sources and an effective density of 4.5 source deg−2 (Fig. 4). The final catalog, available at the J-PLUS database and the Centre de Données astronomiques de Strasbourg (CDS), is described in Appendix A.
The parallax distribution of the final sample is shown in Fig. 5. The distribution for H-dominated white dwarfs peaks at ϖ ≈ 3 mas, while for He-dominated white dwarfs it peaks at ϖ ≈ 4.5 mas. This difference is caused by the combination of the physical properties of the sample with the selection  < 20 mag: at small parallaxes, only the hottest white dwarfs are detected, where the fraction of He-dominated atmospheres tends to be 5–10% (Fig. 3), while at larger parallaxes, cooler white dwarfs are included in the sample and fHe tends to 25%. As a result, a peak at larger parallax is effectively produced for He-dominated atmospheres compared to H-dominated ones. It should be recalled that the variable Veff in the catalog provides the effective detection volume for each white dwarf, allowing selection effects to be corrected. Regarding the quality of the prior parallax information from Gaia EDR3 used in the fitting process, it was found that 96% of the sources have a signal-to-noise ratio (S/N) in the parallax measurement of S/N > 3, with 85% having S/N > 5 (Fig. 6).
Spectroscopic classification is available for 56% of the sources in the catalog, corresponding to 4407 (29%) with R ≳ 500 (SDSS DR17, Vincent et al. 2023; DESI EDR, Manser et al. 2024; 40 pc sample, O’Brien et al. 2024; 100 pc sample, Kilic et al. 2025), and 3969 (27%) from Gaia low-resolution BP/RP spectra (Vincent et al. 2024) without higher-resolution information. Consequently, 6468 (44%) white dwarfs in the catalog are classified solely on the basis of J-PLUS photometry. The magnitude distribution of these subsamples is presented in Fig. 7. Sources with spectra dominate at  < 19 mag, with only 6% lacking spectroscopic classification. At fainter magnitudes, J-PLUS becomes the primary resource, with 60% of the sources lacking spectroscopic data. While ongoing and future spectroscopic surveys are expected to increase the number of classified objects, J-PLUS will continue to provide valuable photometric information, even with full spectroscopic coverage.
The validation of the Teff and log g measurements from J-PLUS photometry is presented in López-Sanjuan et al. (2022a, 2024a). In summary, the typical uncertainty in Teff at temperatures lower than 30 000 K is 5%, while the uncertainty in log g is mainly dictated by the Gaia parallax and is 0.15 dex at Teff < 30 000 K. The J-PLUS spectral classification is further tested in Sect. 5 using those sources with spectroscopic information.
4 Dimensionality reduction to investigate outlier white dwarfs
This section is devoted to the analysis of the outlier population, as defined in Sect. 4.1, using dimensionality reduction tools to explore the 12-dimensional J-PLUS data in a two-dimensional space (Sect. 4.2). The physical origin of the different populations found is explored in Sect. 4.3.
4.1 Definition of outliers
We defined the χ2 parameter as
 (6)
(6)
where the index j runs the 12 J-PLUS passbands, and  is the best-fitting model vector following the procedure described in Sect. 3.3 to estimate pCa- This minimizes the impact of metal pollution in the SED-fitting process.
The χ2 distribution of the 14 844 white dwarfs in the catalog is presented in the left panel of Fig. 8. The residuals are found to follow a χ2 distribution with 10 degrees of freedom (d.o.f.), which is consistent with the 12 photometric points from J-PLUS and the two parameters in the fit, corresponding to the effective temperature and spectral type (López-Sanjuan et al. 2022a). Surface gravity is not considered an effective parameter because it is well constrained by the Gaia parallax prior, coupled with the assumption of a mass-radius relation in the models.
When the high-χ2 tail is analyzed (right panel in Fig. 8), a clear excess of objects is found. Taking χ2 ≥ 23.2 as a reference, corresponding to a 99% cumulative probability in the expected distribution, 771 sources (5% of the sample) are observed, whereas only 148 would be expected. Hereafter, sources with χ2 ≥ 23.2 were defined as outliers and those with χ2 < 23.2 as inliers. This approach is similar to that presented in Covey et al. (2007) to spot outlier stars in a seven-dimensional color space.
 |
Fig. 4 Sky distribution of the 14 844 white dwarfs in the J-PLUS DR3 catalog. The solid line depicts the position of the Milky Way disk, and the dashed lines correspond to ±10 deg in Galactic latitude. |
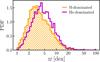 |
Fig. 5 Probability distribution function of the parallax (ϖ) for H-dominated (hatched, orange) and He-dominated (solid, purple) atmospheres in the final J-PLUS DR3 catalog. |
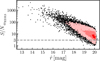 |
Fig. 6 Signal-to-noise ratio in the Gaia EDR3 parallax ( |


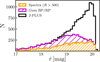 |
Fig. 7 Stacked histogram in |

4.2 Analysis of outlier white dwarfs using UMAP
In the present study, we used UMAP to analyze the white dwarf outliers. This dimensionality reduction technique is primarily used for visualizing high-dimensional data in a lower-dimensional space, typically 2D. It is based on manifold learning and topological data analysis, aiming to preserve both the local and global structure of the data. The UMAP algorithm works by constructing a graph of the data neighbors and optimizing a layout in the lower-dimensional space to best maintain the relationships between points.
We applied the UMAP algorithm to the normalized residuals (ƒ − ƒbest)/σf instead of to the J-PLUS photometric data. This approach has three advantages. First, the twelve input variables are naturally normalized to a common meaningful scale. Second, it reduces most of the population to random noise, eliminating the structure present in the fluxes due to variations in effective temperature, surface gravity, and main composition. Finally, the random population allows us to define an area in the UMAP manifold consistent with statistical fluctuations, amplifying the presence of physical populations that exhibit a systematic pattern in the residuals. This last point should enable the identification of white dwarfs not represented by the theoretical models used, such as DZs, DQs, or binary systems.
The algorithm has two parameters, n_neighbors and min_dist. The n_neighbors parameter controls the number of neighboring points considered when constructing the local neighborhood graph. A smaller value tends to preserve local structure, while a larger value captures more global relationships. The min_dist parameter determines the minimum distance between points in the embedded space, influencing the clustering of points. Smaller values allow for denser clusters, while larger values lead to more spread-out embeddings. Several values for both parameters were explored, and the overall structure of the 2D manifold was found to be preserved regardless of the chosen parameters. We set the final configuration to n_neighbors = 100 and min_dist = 0.5. To ensure reproducibility, random_state = 1906 was used. The 2D UMAP manifold of the J-PLUS 12-dimensional residuals is shown in the top-left panel of Fig. 9. Three main populations were found: a circular concentration plus two appendices, one at UMAP1 < 7.5 and another at UMAP2 > 2.5. In These populations are analyzed in the next section.
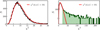 |
Fig. 8 Distribution of χ2 values for the white dwarf sample (black histograms). The red lines represent the theoretical χ2 distribution with 10 degrees of freedom. The right panel shows the same data with the y-axis in logarithmic scale and an expanded x-axis range. The green histogram highlights the 771 outlier sources with χ2 ≥ 23.2. |
4.3 Understanding the UMAP distribution
To understand the three populations in the UMAP space, the locations of outliers and inliers were first explored. The inliers with χ2 < 23.2 are concentrated in the main circular population, exhibiting a trend for larger χ2 near the borders (top-right panel in Fig. 9). Outliers with χ2 ≥ 23.2 populate the two appendices (bottom-left panel in Fig. 9). Notably, some outliers are also found in the main circular region.
The region populated by the inliers defines the location of random noise sources, a fact that was used to select outliers compatible with random fluctuations in the photometry. We performed a novelty detection using the Local Outlier Factor (LOF) function from scikit-learn11 trained on sources with χ2 < 16.0. This training set encompasses 90% of the χ2 distribution and ensures a pure random sample. The parameters used where n_neighbors = 250, contamination = 0.001, and novelty = True. The model was then applied to the outlier sources, and an outlier type Tout was assigned as follows (bottom-right panel in Fig. 9): Tout = 1 for white dwarfs classified as inlier by LOF (391 sources), Tout = 2 for LOF outliers with UMAP1 > 9 (98 sources), and Tout = 3 for LOF outliers with UMAP1 < 9 (282 sources). We assigned Tout = 0 to the remaining 14073 white dwarfs with χ2 < 23.2.
The relative fractional contribution of each outlier type to the total outlier population, ƒout, and its variation with χ2 is presented in Fig. 10. We find that Tout = 1 dominates at the lower χ2, with ƒout ≈ 0.65, and then steadily declines to ƒout ≈ 0.10 above χ2 = 100. The situation is the opposite for the other two outlier types, which increase in relative importance and reach ƒout ≈ 0.20 for Tout = 2 and ƒout ≈ 0.65 for Tout = 3 at χ2 > 100. In the following sections, we examine each type of outlier to better understand their nature.
4.3.1 The random outliers
To explore patterns in outlier populations, a Gaussian was fit to the distribution of  values. The obtained medians and dispersions for Tout = 0 and Tout = 1 sources are presented in Fig. 11. The inliers present the expected behavior of random fluctuations: the obtained medians are close to zero and the dispersion is nearly 0.90, similar to the expected 0.91 for 12 filters and 10 d.o.f. (López-Sanjuan et al. 2022a). Interestingly, white dwarfs with Tout = 1 also have a median close to zero but with enhanced dispersions, reaching 1.6 on average. This suggests that the origin of the large χ2 may be an underestimation of the uncertainties (a plausible situation at the brighter magnitudes), inaccurate measurements in a limited number of bands, or small deviations between the assumed models and the actual composition, such as white dwarfs with mixed spectral types (DBA, DAB) or hot DOs (our He-dominated models only reach Teff = 40 000 K, and above this effective temperature only H-dominated models are used). The higher fraction of Tout = 1 sources at low χ2 values with respect to Tout = 2 and Tout = 3 classes (Fig. 10) is also consistent with a random nature, since 148 sources within the outlier population are expected from the χ2 distribution properties and should concentrate near the χ2 = 23.2 boundary (Sect. 4.1).
In addition, ZZ Ceti variable white dwarfs were tested as a possible source of random outliers. Sources within the instability strip, as defined in Tremblay et al. (2015), and with masses M ≥ 0.45 M⊙ were selected. This selection resulted in a sub-set of 1783 white dwarfs from our sample. Only 53 (3%) were classified as Tout = 1, with 7 and 5 classified as Tout = 2 and Tout = 3, respectively. The sources in the Tout = 0 category did not display any evident trend beyond randomness at any magnitude, with a median of zero and the expected dispersion in the normalized residuals. Therefore, we concluded that the J-PLUS observational strategy, which includes three consecutive exposures per passband and a typical time span of 45–90 min to observe the 12 filters, combined with the typical ZZ Ceti periods (3–15 min; Vincent et al. 2020) and amplitudes (≲0.2 mag; Vincent et al. 2020), makes the final J-PLUS photometry largely insensitive to their flux variability.
In summary, no clear physical population is found to be associated with the Tout = 1 outliers, which appear to comprise a variety of origins. The large χ2 may arise from instrumental causes, such as underestimated errors or inaccurate measurements, or from physical causes; however, this does not result in a clear pattern in the residuals from the SED-fitting process.
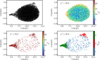 |
Fig. 9 Two-dimensional UMAP manifold of the J-PLUS 12-dimensional residuals space, (ƒ − ƒbest)/σƒ. Top-left panel: distribution of the full sample (black dots). Top-right panel: distribution of the sources with χ2 < 23.2, as shown in the color scale. Bottom-left panel: distribution of the outliers with χ2 ≥ 23.2. Bottom-right panel: definition of the three types of outliers (Tout), as indicated in the color bar. |
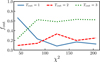 |
Fig. 10 Relative fraction of each outlier type, ƒout, as a function of χ2. The blue, green, and red lines depict ƒout for Tout = 1, 2, and 3, respectively. |
4.3.2 The metal-polluted outliers
The pCa values for the outlier populations are presented in Fig. 12. White dwarfs with Tout = 2 are found to have a high probability of exhibiting calcium absorption and therefore can be assigned to the class of metal-polluted white dwarfs. The top panel of Fig. 13 shows the distribution of the normalized residuals. A large, 5.1σ flux deficit is observed in the J0395 band, and in the u and J0378 passbands (although less significant). Conversely, a flux excess is present in the ɡ, J0515, and r pass-bands. This behavior is apparent in the source presented in the bottom-right panel in Fig. 1.
Despite the strong correlation between Tout = 2 outliers and large pCa values, exceptions are found. First, some sources with pCa > 0.5 in the random-noise area (bottom panel in Fig. 12), clustered near the Tout = 2 region at UMAP2 > 2.5. We find 20 with Tout = 1 and 75 with Tout = 0, presenting a noticeable deficit in J0395 at the 3.6σ and 3.0σ levels, respectively, and approaching a zero difference in the other passbands (middle and bottom panels in Fig. 13). There are also nine sources with pCa > 0.5 in the Tout = 3 population, but they can be discarded as false positives, as demonstrated in the following section. The Teff distribution for pCa > 0.5 sources and different outlier types are similar, suggesting that the sequence represents an increase in calcium abundance from Tout = 0 to Tout = 2.
Only six sources have Tout = 2 and pCa < 0.5. These comprise three sources classified as metal-polluted, two magnetic white dwarfs, and one DC. This strengthens the capability of the Tout = 2 selection to identify metal-polluted systems.
Finally, motivated by the clustering of sources with pCa > 0.5 in the region where UMAP2 > 2.5, 575 sources were selected with Tout = 0, pCa < 0.1, and UMAP2 > 2.5. A deficit in the J0395 filter is observed at a l.8σ level. However, this signal can be ruled out as representative by performing the same analysis for the 549 sources with Tout = 0, pCa < 0.1, and UMAP2 < −3.2, i.e., at the opposite end of the 2D manifold. In this case, an excess in the J0395 filter is obtained, with the same statistical significance of l.8σ. This suggests that the UMAP2 axis is dominated by the residual in the J0395 filter, a hypothesis confirmed by the analysis of the median residual along the UMAP manifold12 (Fig. 14). This highlights that the statistical approach used in the estimation of pCa is critical, as spurious detections due to statistical fluctuations are minimized.
In summary, Tout = 2 is sensitive to the presence of different metals and can be used to select a high-confidence sample of metal-polluted white dwarfs, complementing the pCa measurement based solely on the J0395 passband and sensitive only to Ca absorption.
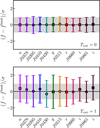 |
Fig. 11 Normalized residuals for the different J-PLUS photometric bands, as labeled on the x-axis. The median and the dispersion of the best Gaussian describing the residuals of the population are shown with the symbols and the error bars, respectively. The solid black line depicts a zero difference, and the shaded region represents the expected range for a random distribution. The top panel corresponds to the outlier type Tout = 0 and the bottom panel to Tout = 1. |
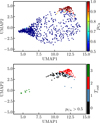 |
Fig. 12 Two-dimensional UMAP manifold for the J-PLUS 12-dimensional residuals space. Top panel: distribution of the outliers color-coded by their pCa. Bottom panel: distribution of all sources with pCa > 0.5 color-coded with Tout. |
4.3.3 The two-component outliers
Analysis of the Tout = 3 sources reveals that most correspond to two-component systems consisting of a blue white dwarf and a redder component, but other types of white dwarf are also included, as analyzed in the latter part of this section. The red component is not always physically associated; in several cases, it results from contamination by a nearby red star or by a galaxy. The median residuals of the population with Tout = 3 are shown in Fig. 15. An excess is observed in both the bluer and the redder filters, while a deficit is present in the intermediate filters, mainly J0515, r, and J0660.
The inferred mass distribution of the outlier populations is presented in Fig. 16, with the mass estimated as MH ×pH + MHe × (1 − pH). Extremely low-mass objects dominate the Tout = 3 population. This finding is consistent with the two-component scenario, as fitting these systems under the assumption of a single white dwarf often leads to an apparent over-luminous, low-mass solution. The distribution of Tout = 1 sources exhibits a population of low-mass objects, though peaking at higher masses than those in the Tout = 3 category. It should be noted that only systems displaying a significant deviation from random fluctuations are classified as Tout = 3, while additional two-component candidates, including double degenerates, can be identified based on their apparent low-mass solutions. Indeed, the fraction of sources with M ≤ 0.45 M⊙ is 0.17, 0.32, 0.10, and 0.84 when moving from Tout = 0 to Tout = 3.
We identified a total of 46 sources with Tout = 3 and M > 0.45 M⊙ (16% of the population). A detailed analysis using SIMBAD, the MWDD, and the available J-PLUS photometry reveals the following demographics: 18 objects with contaminated photometry; 11 WDMS candidates (of which only two are spectroscopically confirmed); seven DQs (five with available spectra); five DAs (including a double degenerate, a confirmed ZZ Ceti, and two without spectra); one cataclysmic variable; one DO; one DBA; one DAB; and one DABH. Consequently, 63% of the Tout = 3 high-mass sources are classified as two-component systems, 33% as other noteworthy types, and only 4% appear to be standard non-variable DAs.
The identified DQs are cool and present prominent Swan molecular bands (Fig. 17). Their residuals resemble the two-component behavior, with a clear deficit in ɡ and J0515. The C/He abundances and Teff values available for DQs with spectra were retrieved from the MWDD, with 44 sources in common with the J-PLUS DR3 catalog. Their C/He abundance as a function of Teff is presented in Fig. 18. Most DQs (40) have Tout = 0 or Tout = 1, consistent with random noise. The only four DQs with Tout = 3 fall within the sequence of DQs with strong carbon absorption, which typically have a 1 dex larger abundance than normal DQs (Dufour et al. 2005; Koester & Knist 2006; Coutu et al. 2019; Blouin & Dufour 2019). This implies that J-PLUS is sensitive to carbon absorption only when the spectrum is strongly affected. Therefore, a method to select DQ candidates with strong carbon features is to focus on sources having Tout = 3 and M > 0.45 M⊙, with a 15% success rate after inspecting only 0.3% of the total initial sample.
In summary, Tout = 3 sources are primarily identified as two-component systems, either physically associated or projected.
Additionally, DQs with strong carbon absorption are included in this category. The capabilities of the Tout = 3 population to select WDMS is further tested in Sect. 5.3.
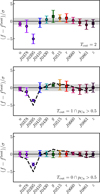 |
Fig. 13 Same as shown in Fig. 11, but for white dwarfs with Tout = 2 (top panel), Tout = 1 and pCa > 0.5 (middle panel), and Tout = 0 and pCa > 0.5 (bottom panel). The dashed lines depicts the median points in the Tout = 2 case for reference. |
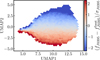 |
Fig. 14 Median value of the normalized residuals in the J0395 pass-band along the UMAP two-dimensional manifold. |
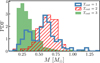 |
Fig. 16 Probability distribution function of the estimated stellar mass for sources with Tout = 1 (empty histogram), Tout = 2 (hatched histogram), and Tout = 3 (filled histogram). |
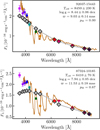 |
Fig. 17 Same as Fig. 1, but for two white dwarfs with Tout = 3, M > 0.45 M⊙, and spectroscopically classified as DQ. The SDSS spectrum of the source is shown with the brown solid line. |
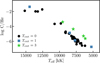 |
Fig. 18 Carbon-to-helium abundance ratio (C/He) as a function of Teff for DQs with spectroscopic measurements and Tout = 0 (black circles), Tout = 1 (blue squares), and Tout = 3 (green stars). |
5 Comparison between J-PLUS and other classifications
The comparison with SDSS DR16 spectroscopy, visually classified in GF21, is presented in López-Sanjuan et al. (2022a). In that work, the reliability of the probability pH as an indicator of an H-dominated atmosphere is established by comparing the fraction of objects spectroscopically classified as DA as a function of pH. After applying the prior on spectral type (Sect. 3.2), a one-to-one relation is obtained, demonstrating that the probabilities are reliable. A similar result was obtained in López-Sanjuan et al. (2024a) for the probability pCa and the presence of metals in the atmosphere of white dwarfs. The reader is referred to these works for further details.
We repeated this analysis with the new J-PLUS DR3 catalog and obtained similar results. Therefore, in the following sections, the focus is on comparing the classifications obtained with J-PLUS DR3 to recent studies that have classified white dwarfs by applying machine learning techniques to SDSS DR17 spectra (Vincent et al. 2023; Sect. 5.1.1), to the Gaia DR3 BP/RP spectral coefficients (Vincent et al. 2024; García-Zamora et al. 2023; Kao et al. 2024; Sect. 5.2), and to visual classifications in DESI EDR (Manser et al. 2024; Sect. 5.1.2). Finally, an evaluation of the performance in identifying WDMS systems is presented in Sect. 5.3.
5.1 Comparison with spectroscopic classifications
In this section, the comparison with spectroscopic classifications was restricted to sources with M ≥ 0.45 M⊙ and 5000 < Teff < 30 000 K in J-PLUS DR3 to ensure adequate coverage of the theoretical models.
5.1.1 SDSS DR17 spectroscopy
In Vincent et al. (2023), a total of 36 523 white dwarfs with spectra from SDSS DR17 (R ~ 2000) were analyzed using supervised machine learning tools. The classifier was trained on spectra with S/N > 9 and visual classifications from GF21. The model output corresponds to the probability of a given spectral type, with the primary type (DA, DB, DC, DZ, DQ, DO, among others) recovered with an accuracy of ≳90%.
The comparison was carried out on sources with S/N > 9 in SDSS DR17 spectra. A total of 2331 objects were found in common. We assessed the reliability of pH by comparing the mean PDA from Vincent et al. (2023) with the mean pH in J-PLUS, at different pH values (Fig. 19). The results are consistent with the one-to-one relation, as expected, and deviate by less than 0.01 from those obtained with the visual spectral classification from GF21. This outcome was anticipated given the performance of the Vincent et al. (2023) classifier.
Of the 72 white dwarfs classified as DZ by Vincent et al. (2023) that are also present in our sample, only 29 have pCa > 0.5. This can be explained as a reflection of the S/N in EWJ0395, which serves as the source of information on calcium absorption in J-PLUS. The distribution of pCa for objects classified as DZ at different significance levels in EWJo395 is shown in Fig. 20. All sources with S/N > 3 have pCa > 0.8, while those with S/N < 1.5 have pCa < 0.2. As an additional test, the PDZ probabilities were compared with pCa (Fig. 19). Once again, the measurements are consistent with the one-to-one relation, demonstrating that the pCa values accurately represent the capability of J-PLUS to detect the presence of calcium in white dwarf atmospheres.
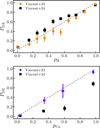 |
Fig. 19 Mean probability from machine learning classification as a function of the mean probability from J-PLUS. Circles and squares show the results from SDSS DR17 spectra (Vincent et al. 2023, Sect. 5.1.1) and Gaia BP/RP spectra (Vincent et al. 2024, Sect. 5.2.1), respectively. The dotted line marks the one-to-one relation. Top panel: PDA as a function of pH- Bottom panel: PDZ as a function of pCa. |
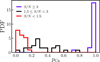 |
Fig. 20 Probability distribution function of DZ white dwarfs from SDSS DR17 in pCa for three different S/N selections in EWJ0395: S/N ≥ 3 (purple), 1.5 ≤ S/N < 3 (black), and S/N < 1.5 (red). |
5.1.2 DESI EDR spectroscopy
The DESI EDR (R ~ 3500) provides visual spectral types for 2706 individual white dwarfs and 66 binary systems (Manser et al. 2024). A total of 564 objects were found in common with J-PLUS DR3. The fraction of DAs in DESI as a function of pH is presented in Fig. 21. The measurements are compatible with the one-to-one relation, providing another independent validation of the probabilities from J-PLUS.
Only 15 DESI DZs are included in the J-PLUS DR3 catalog, of which six have pCa > 0.5 or Tout = 2. As discussed in the previous section, this reflects the S/N in EWJ0395, with the six metal-polluted white dwarfs from J-PLUS having S/N > 2.5, while the remaining nine exhibit S/N ≲ 1.
Comparison with spectral classification based on SDSS DR17 and DESI EDR confirmed that the probabilities pH and pCa are reliable, representing the correct fraction of DA and DZ spectral type objects, respectively. This allows these probabilities to be used for statistical studies, with appropriate weighting of each object (López-Sanjuan et al. 2022a), to select DZ candidates with a high success rate (López-Sanjuan et al. 2024a), and to test other classifications using J-PLUS as an intermediate step from spectroscopy. The latter case is explored in the following section, where the probabilities pH and pCa are compared with various classifications based on the BP/RP spectra from Gaia DR3.
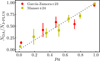 |
Fig. 21 Fraction of white dwarfs classified as DA as a function of pH. Squares and circles show the results from DESI EDR (Manser et al. 2024, Sect. 5.1.2) and Gaia BP/RP spectra (García-Zamora et al. 2023, Sect. 5.2.2), respectively. The dotted line marks the one-to-one relation. |
5.2 Gaia DR3 BP/RP spectra
In this section, classifications based on the Gaia DR3 BP/RP spectra (R = 30–90) are compared with the information in the J-PLUS DR3 catalog. The classifications from Vincent et al. (2024), García-Zamora et al. (2023), and Kao et al. (2024) are explored. In all cases, the 110 coefficients that describe the BP/RP spectra were analyzed using machine learning techniques.
5.2.1 Comparison with Vincent et al. 2024
Using a gradient-boosting classifier trained with the spectroscopic labels from SDSS DR17, Vincent et al. (2024) provide the main spectral-type (DA, DB, DC, DO, DZ, DQ) probability for 100 188 white dwarfs. Following the discussion in the previous section, the main probabilities for DA and DZ in Vincent et al. (2024) were compared with pH and pCa for the 5380 objects in common (Fig. 19), after restricting the sample to sources with M ≥ 0.45 M⊙ and 5000 < Teff < 30000 K in J-PLUS.
We find a close agreement between PDA and pH, with a slight overconfldence for PDA at pH < 0.8. The performance for DA classification reached 98% precision and recall, according to Vincent et al. (2024). Therefore, the agreement with the J-PLUS probability is expected. The situation differs for metal-polluted systems, where we find a lower PDZ with respect to pCa. This suggests an under-confidence in the probability from Vincent et al. (2024), reflecting the 60% precision and 85% recall estimated for their DZ classification.
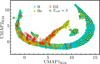 |
Fig. 22 Manifold generated with UMAP from Kao et al. (2024), based on Gaia BP/RP spectral coefficients. Symbols represent different J-PLUS classes: H-dominated atmosphere (cyan circles), He-dominated atmospheres (yellow triangles), metal-polluted atmospheres (pCa > 0.5 or Tout = 2; red diamonds), and Tout = 3 sources (green stars). |
5.2.2 Comparison with García-Zamora et al. (2023)
A random forest algorithm is used by García-Zamora et al. (2023) to obtain the spectral types for 9448 white dwarfs in the 100 pc sample presented by Jiménez-Esteban et al. (2023). In this case, sources with M ≥ 0.45 M⊙ and 6000 < Teff < 30 000 K in J-PLUS were used. A total of 465 white dwarfs in common were found.
The fraction of white dwarfs classified as DA as a function of pH is presented in Fig. 21. The lower number of objects translates to large error bars, and the measurements are compatible with the desired one-to-one relation. The high precision and recall (>90%) estimated by García-Zamora et al. (2023) for DAs are consistent with these results.
The number of metal-polluted white dwarfs is not large enough to perform the statistical analysis. On the one hand, there are 17 DZs from García-Zamora et al. (2023) in the J-PLUS DR3 catalog, of which 15 (90%) have pCa ≥ 0.5 or Tout = 2. The two discrepant sources have S/N < 2.5 in EWJ0395 and are classified spectroscopically as DZs, highlighting the high precision (>90%) of the García-Zamora et al. (2023) classification. On the other hand, there are 14 sources with pCa > 0.9 in common, of which 12 are classified as DZ, one as DA, and one as DC. This translates to an 85% agreement. There is no spectroscopic information for the two discrepant sources, but J0395 absorption is clearly detected in both systems and is even apparent in the Gaia BP/RP spectra.
5.2.3 Comparison with Kao et al. (2024)
As a final comparison, we studied the correlation between the results from J-PLUS and the UMAP manifold analysis presented in Kao et al. (2024), hereafter denoted UMAPK24· A total of 6323 sources are found in common (Fig. 22). We obtained results similar to those reported in Kao et al. (2024) using spectroscopic classes. The UMAPK24 manifold shown in Fig. 22 exhibits a characteristic horseshoe shape, with H-dominated white dwarfs forming the majority of its population. This structure reflects an effective-temperature sequence in which the hotter DAs are located on the right side of the horseshoe, with progressively cooler ones extending toward the left. The central arm is occupied by He-dominated atmospheres. Metal-polluted systems with pCa > 0.5 or Tout = 2 dominate the region at UMAPK24 coordinates (1,2), and are also spread along the He-dominated arm and at cool temperatures, consistent with the results of Kao et al. (2024). Finally, the Tout = 3 sources are highlighted. The population at UMAPK24 coordinates (2,2), suggested as binaries by Kao et al. (2024), is not well populated by Tout = 3 sources. An inspection shows that half of all the white dwarfs in this area (85% for those with Tout = 3) are associated in J-PLUS images with a nearby red source, which is likely contaminating the BP/RP spectra at the red end. A concentration is observed at UMAPK24 coordinates (11,3). In this case, only 20% of the Tout = 3 sources have contaminated photometry, suggesting that this area is dominated by unresolved binary systems (see Pérez-Couto et al. 2025 for a similar conclusion). The location of DQs with strong carbon absorption was also explored. An excess is found at UMAPK24 coordinates (−2.3,7.5), where a strip is present in the manifold of Kao et al. (2024). This was not discussed by the authors, and the sources in this strip are classified as DQs by Vincent et al. (2024).
5.3 Selection of WDMS systems
In this section, we compare several spectroscopic catalogs of WDMS systems with the classification from J-PLUS, particularly focusing on sources with Tout = 3, as they are dominated by two-component systems. All sources in the J-PLUS DR3 white dwarf catalog were used in the comparison.
The first comparison is with the WDMS catalog from SDSS spectra collected over multiple releases (Rebassa-Mansergas et al. 2010, 2012, 2016). The latest version of the catalog contains 3287 systems from SDSS DR12, with 45 in common with J-PLUS DR3. Among these sources, 26 (58%) are assigned Tout = 3, while 19 (42%) are assigned Tout = 1 or 0. When a mass-based selection is applied, objects with Tout = 3 account for 77% (24/31) and 14% (2/14) of the sources with masses below and above 0.45 M⊙, respectively.
A machine learning model was trained by Vincent et al. (2023) to identify binary sources in SDSS DR17 spectra. In the total J-PLUS DR3 catalog, 82 objects were classified as WDMS by Vincent et al. (2023), with 46, 6, 0, and 30 assigned to Tout = 0, 1, 2, and 3, respectively. The outlier type does not appear to be effective in selecting binary systems, as only 36% are placed in the two-component class, while 65% are assigned to other categories. However, the Tout = 3 sources account for 90% (28/31) of spectroscopic binaries with masses below 0.45 M⊙ and 4% (2/51) of those above this limit.
Seven WDMS from DESI (Manser et al. 2024) are classified in the J-PLUS catalog, with six having M ≤ 0.45 M⊙. Of the low-mass objects, five (85%) are assigned Tout = 3. The single object with M > 0.45 M⊙ has Tout = 0.
Finally, a total of 14 WDMS are in common between J-PLUS DR3 and the Large Sky Area Multi-Object Fiber Spectroscopic Telescope (LAMOST, Cui et al. 2012) DR5 binary catalog presented in Ren et al. (2018). In this case, all seven low-mass objects with M < 0.45 M⊙ are classified as Tout = 3 sources, while 20% (2/7) of the M > 0.45 M⊙ sources have Tout = 3.
In summary, the comparison with spectroscopic WDMS catalogs shows that 80–100% of the WDMS systems with low-mass solutions in J-PLUS have Tout = 3, compared to only 5–20% of the WDMS systems with M > 0.45 M⊙. This result suggests that objects with clearly distorted colors compared to the case of a single white dwarf are classified as Tout = 3, which in most cases also implies a brighter magnitude (lower mass) than expected for a single object. Cases with a subtle companion exhibit both J-PLUS colors and magnitudes compatible with the single white dwarf scenario.
6 Summary and conclusions
The J-PLUS DR3 white dwarf catalog comprises a total of 14 844 sources with r ≤ 20 mag and parallaxes in the range 1 ≤ ϖ < 100 mas over 3284 deg2. We anallysed the 12-band J-PLUS photometry with Bayesian SED-fitting techniques to derive the effective temperature and surface gravity of the sources. Priors on parallax and spectral type were applied to improve the reliability of the estimates. Furthermore, we determined the probability that each object has an H-dominated atmosphere and exhibiting calcium absorption (pCa).
We applied the UMAP dimensionality reduction technique to the 12-dimensional, uncertainty-normalized residuals from the SED-fitting analysis to investigate outliers, defined as sources that exhibit significant deviations from theoretical atmospheric models (χ2 ≥ 23.2; 771 sources). The resulting 2D distribution reveals three distinct types of outliers: Tout = 1 (391 sources), compatible with random measurement fluctuations and occupying the same UMAP locus as sources with χ2 < 23.2; Tout = 2 (98 sources), comprising metal-polluted white dwarfs; and Tout = 3 (282 sources), dominated by two-component systems consisting of a white dwarf with a red companion (physical or in projection), and also including DQs with strong carbon absorption features.
The J-PLUS probabilities were compared with atmospheric types from SDSS DR17, DESI EDR, and Gaia DR3 BP/RP spectra. We conclude that both pH and pCa are reliable, accurately representing the probability of selecting a DA and a DZ, respectively.
The J-PLUS DR3 catalog presented in this work serves as a starting point for future statistical analyses of the white dwarf population. The techniques developed for the analysis of outliers will be essential for the ongoing J-PAS project. With its 56 narrow optical bands, J-PAS will enhance spectral classification (López-Sanjuan et al. 2022b) and improve the characterization of outliers with respect to J-PLUS.
Data availability
The J-PLUS DR3 white dwarf catalog described in Appendix A is available at the CDS via https://cdsarc.cds.unistra.fr/viz-bin/cat/J/A+A/701/A273. It is also accessible in the J-PLUS database13 at the table jplus.WhiteDwarf, and through the Virtual Observatory Table Access Protocol (TAP) service14.
Acknowledgements
We dedicate this paper to the memory of our six IAC colleagues and friends who met with a fatal accident in Piedra de los Cochinos, Tenerife, in February 2007, with special thanks to Maurizio Panniello, whose teachings of python were so important for this paper. We thank the anonymous referee for useful comments and suggestions. Based on observations made with the JAST80 telescope at the Observatorio Astrofísico de Javalambre (OAJ), in Teruel, owned, managed, and operated by the Centro de Estudios de Física del Cosmos de Aragón. We acknowledge the OAJ Data Processing and Archiving Unit (UPAD, Cristóbal-Hornillos et al. 2012) for reducing and calibrating the OAJ data used in this work. Funding for the J-PLUS Project has been provided by the Governments of Spain and Aragón through the Fondo de Inversiones de Teruel; the Aragonese Government through the Research Groups E96, E103, E16_17R, E16_20R, and E16_23R; the Spanish Ministry of Science and Innovation (MCIN/AEI/10.13039/501100011033 y FEDER, Una manera de hacer Europa) with grants PID2021-124918NB-C41, PID2021-124918NB-C42, PID2021-124918NA-C43, and PID2021-124918NB-C44; the Spanish Ministry of Science, Innovation and Universities (MCIU/AEI/FEDER, UE) with grants PGC2018-097585-B-C21 and PGC2018-097585-B-C22; the Spanish Ministry of Economy and Competitiveness (MINECO) under AYA2015-66211-C2-1-P, AYA2015-66211-C2-2, AYA2012-30789, and ICTS-2009-14; and European FEDER funding (FCDD10-4E-867, FCDD13-4E-2685). The Brazilian agencies FINEP, FAPESP, and the National Observatory of Brazil have also contributed to this project. This research received funding from the European Research Council under the European Union’s Horizon 2020 research and innovation programme number 101002408 (MOS100PC). A. d. P. acknowledges financial support from the Severo Ochoa grant CEX2021-001131-S funded by MCIN/AEI/10.13039/501100011033. A. E., J. A. F. O., and J. V. F. acknowledge the financial support from the Spanish Ministry of Science and Innovation and the European Union - NextGenerationEU through the Recovery and Resilience Facility project ICTS-MRR-2021-03-CEFCA. This work was partially supported by MICIU/AEI/10.13039/501100011033 grants PID2023-148661NB-I00, PID2023-146210NB-I00 and the AGAUR/Generalitat de Catalunya grant SGR-386/2021. P. C. acknowledges financial support from the Spanish Ministry of Science and Innovation/State Agency of Research MCIN/AEI/10.13039/501100011033 through grants PID2019-107061GB-C61 and the Spanish Virtual Observatory project PID2020-112949GB-I00. J. V. acknowledges the technical members of the UPAD for their invaluable work: Juan Castillo, Javier Hernández, Ángel López, Alberto Moreno, and David Muniesa. This work has made use of data from the European Space Agency (ESA) mission Gaia (https://www.cosmos.esa.int/gaia), processed by the Gaia Data Processing and Analysis Consortium (DPAC, https://www.cosmos.esa.int/web/gaia/dpac/consortium). Funding for the DPAC has been provided by national institutions, in particular the institutions participating in the Gaia Multilateral Agreement. Funding for SDSS-III has been provided by the Alfred P. Sloan Foundation, the Participating Institutions, the National Science Foundation, and the U.S. Department of Energy Office of Science. The SDSS-III web site is http://www.sdss3.org/. SDSS-III is managed by the Astrophysical Research Consortium for the Participating Institutions of the SDSS-III Collaboration including the University of Arizona, the Brazilian Participation Group, Brookhaven National Laboratory, Carnegie Mellon University, University of Florida, the French Participation Group, the German Participation Group, Harvard University, the Instituto de Astrofisica de Canarias, the Michigan State/Notre Dame/JINA Participation Group, Johns Hopkins University, Lawrence Berkeley National Laboratory, Max Planck Institute for Astrophysics, Max Planck Institute for Extraterrestrial Physics, New Mexico State University, New York University, Ohio State University, Pennsylvania State University, University of Portsmouth, Princeton University, the Spanish Participation Group, University of Tokyo, University of Utah, Van-derbilt University, University of Virginia, University of Washington, and Yale University. Funding for the Sloan Digital Sky Survey IV has been provided by the Alfred P. Sloan Foundation, the U.S. Department of Energy Office of Science, and the Participating Institutions. SDSS-IV acknowledges support and resources from the Center for High Performance Computing at the University of Utah. The SDSS website is www.sdss.org. SDSS-IV is managed by the Astrophysical Research Consortium for the Participating Institutions of the SDSS Collaboration including the Brazilian Participation Group, the Carnegie Institution for Science, Carnegie Mellon University, Center for Astrophysics I Harvard & Smithsonian, the Chilean Participation Group, the French Participation Group, Instituto de Astrofísica de Canarias, The Johns Hopkins University, Kavli Institute for the Physics and Mathematics of the Universe (IPMU) / University of Tokyo, the Korean Participation Group, Lawrence Berkeley National Laboratory, Leibniz Institut für Astrophysik Potsdam (AIP), Max-Planck-Institut für Astronomie (MPIA Heidelberg), Max-Planck-Institut für Astrophysik (MPA Garching), Max-Planck-Institut für Extraterrestrische Physik (MPE), National Astronomical Observatories of China, New Mexico State University, New York University, University of Notre Dame, Observatário Nacional / MCTI, The Ohio State University, Pennsylvania State University, Shanghai Astronomical Observatory, United Kingdom Participation Group, Universidad Nacional Autónoma de México, University of Arizona, University of Colorado Boulder, University of Oxford, University of Portsmouth, University of Utah, University of Virginia, University of Washington, University of Wisconsin, Vanderbilt University, and Yale University. DESI construction and operations is managed by the Lawrence Berkeley National Laboratory. This research is supported by the U.S. Department of Energy, Office of Science, Office of High-Energy Physics, under Contract No. DE-AC02-05CH11231, and by the National Energy Research Scientific Computing Center, a DOE Office of Science User Facility under the same contract. Additional support for DESI is provided by the U.S. National Science Foundation, Division of Astronomical Sciences under Contract No. AST-0950945 to the NSF’s National Optical-Infrared Astronomy Research Laboratory; the Science and Technology Facilities Council of the United Kingdom; the Gordon and Betty Moore Foundation; the Heising-Simons Foundation; the French Alternative Energies and Atomic Energy Commission (CEA); the National Council of Science and Technology of Mexico (CONACYT); the Ministry of Science and Innovation of Spain, and by the DESI Member Institutions. The DESI collaboration is honored to be permitted to conduct astronomical research on Iolkam Du’ag (Kitt Peak), a mountain with particular significance to the Tohono O’odham Nation. This research has made use of the SIMBAD database, operated at CDS, Strasbourg, France. This research made use of Astropy, a community-developed core Python package for Astronomy (Astropy Collaboration 2013), and Matplotlib, a 2D graphics package used for Python for publication-quality image generation across user interfaces and operating systems (Hunter 2007). IA generative models have been used to revise the text.
Appendix A Description of the J-PLUS DR3 white dwarf catalog
The description of the columns in the catalog is provided in Table. A.1.
J-PLUS DR3 white dwarf catalog.
Appendix B Median residuals along the UMAP manifold
The median normalized residuals along the UMAP two-dimensional manifold for the J-PLUS passbands but J0395, already presented in Fig. 14, are shown in Fig. B.1.
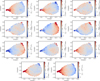 |
Fig. B.1 Median value of the normalized residuals along the UMAP two-dimensional manifold for the u, J0378, J0410, J0430, ɡ, J0515, r, J0660, i, J0861, and z passbands, from top to bottom and left to right. |
References
- Abdurro’uf, Accetta, K., Aerts, C., et al. 2022, ApJS, 259, 35 [NASA ADS] [CrossRef] [Google Scholar]
- Ahumada, R., Prieto, C. A., Almeida, A., et al. 2020, ApJS, 249, 3 [Google Scholar]
- Allende Prieto, C., Cooper, A. P., Dey, A., et al. 2020, RNAAS, 4, 188 [NASA ADS] [Google Scholar]
- Astropy Collaboration (Robitaille, T. P., et al.) 2013, A&A, 558, A33 [NASA ADS] [CrossRef] [EDP Sciences] [Google Scholar]
- Baron, D., & Poznanski, D. 2017, MNRAS, 465, 4530 [NASA ADS] [CrossRef] [Google Scholar]
- Bédard, A. 2024, Ap&SS, 369, 43 [CrossRef] [Google Scholar]
- Benítez, N., Dupke, R., Moles, M., et al. 2014, arXiv e-prints [arXiv: 1403.5237] [Google Scholar]
- Bergeron, P., Dufour, P., Fontaine, G., et al. 2019, ApJ, 876, 67 [NASA ADS] [CrossRef] [Google Scholar]
- Bertin, E., & Arnouts, S. 1996, A&AS, 117, 393 [NASA ADS] [CrossRef] [EDP Sciences] [Google Scholar]
- Blouin, S., & Dufour, P. 2019, MNRAS, 490, 4166 [NASA ADS] [CrossRef] [Google Scholar]
- Blouin, S., Bédard, A., & Tremblay, P.-E. 2023a, MNRAS, 523, 3363 [NASA ADS] [CrossRef] [Google Scholar]
- Blouin, S., Kilic, M., Bédard, A., & Tremblay, P.-E. 2023b, MNRAS, 525, L112 [Google Scholar]
- Bonoli, S., Marín-Franch, A., Varela, J., et al. 2021, A&A, 653, A31 [NASA ADS] [CrossRef] [EDP Sciences] [Google Scholar]
- Byrne, X., Bonsor, A., Rogers, L. K., & Manser, C. J. 2024, MNRAS, 535, 2246 [Google Scholar]
- Camisassa, M., Torres, S., Hollands, M., et al. 2023, A&A, 674, A213 [NASA ADS] [CrossRef] [EDP Sciences] [Google Scholar]
- Cenarro, A. J., Moles, M., Marín-Franch, A., et al. 2014, Proc. SPIE, 9149, 91491I [Google Scholar]
- Cenarro, A. J., Moles, M., Cristóbal-Hornillos, D., et al. 2019, A&A, 622, A176 [NASA ADS] [CrossRef] [EDP Sciences] [Google Scholar]
- Chiappini, C., Minchev, I., Starkenburg, E., et al. 2019, The Messenger, 175, 30 [NASA ADS] [Google Scholar]
- Coutu, S., Dufour, P., Bergeron, P., et al. 2019, ApJ, 885, 74 [NASA ADS] [CrossRef] [Google Scholar]
- Covey, K. R., Ivezic, Ž., Schlegel, D., et al. 2007, AJ, 134, 2398 [NASA ADS] [CrossRef] [Google Scholar]
- Cristóbal-Hornillos, D., Gruel, N., Varela, J., et al. 2012, SPIE CS, 8451, 845116 [Google Scholar]
- Cui, X.-Q., Zhao, Y.-H., Chu, Y.-Q., et al. 2012, Res. Astron. Astrophys., 12, 1197 [Google Scholar]
- Cukanovaite, E., Tremblay, P. E., Freytag, B., Ludwig, H. G., & Bergeron, P. 2018, MNRAS, 481, 1522 [NASA ADS] [CrossRef] [Google Scholar]
- Cukanovaite, E., Tremblay, P. E., Freytag, B., et al. 2019, MNRAS, 490, 1010 [CrossRef] [Google Scholar]
- De Angeli, F., Weiler, M., Montegriffo, P., et al. 2023, A&A, 674, A2 [NASA ADS] [CrossRef] [EDP Sciences] [Google Scholar]
- Dennis, M. T., Hu, E. M., & Cowie, L. L. 2025, ApJ, 983, 173 [Google Scholar]
- Dufour, P., Bergeron, P., & Fontaine, G. 2005, ApJ, 627, 404 [NASA ADS] [CrossRef] [Google Scholar]
- Dufour, P., Blouin, S., Coutu, S., et al. 2017, in Astronomical Society of the Pacific Conference Series, 509, 20th European White Dwarf Workshop, eds. P. E. Tremblay, B. Gaensicke, & T. Marsh, 3 [Google Scholar]
- Edenhofer, G., Zucker, C., Frank, P., et al. 2024, A&A, 685, A82 [NASA ADS] [CrossRef] [EDP Sciences] [Google Scholar]
- Eisenstein, D. J., Liebert, J., Harris, H. C., et al. 2006, ApJS, 167, 40 [CrossRef] [Google Scholar]
- Fontaine, G., Brassard, P., & Bergeron, P. 2001, PASP, 113, 409 [NASA ADS] [CrossRef] [Google Scholar]
- Fustes, D., Manteiga, M., Dafonte, C., et al. 2013, A&A, 559, A7 [NASA ADS] [CrossRef] [EDP Sciences] [Google Scholar]
- Gaia Collaboration (Prusti, T., et al.) 2016, A&A, 595, A1 [NASA ADS] [CrossRef] [EDP Sciences] [Google Scholar]
- Gaia Collaboration (Brown, A. G. A., et al.) 2018, A&A, 616, A1 [NASA ADS] [CrossRef] [EDP Sciences] [Google Scholar]
- Gaia Collaboration (Brown, A. G. A., et al.) 2021a, A&A, 649, A1 [NASA ADS] [CrossRef] [EDP Sciences] [Google Scholar]
- Gaia Collaboration (Smart, R. L., et al.) 2021b, A&A, 649, A6 [EDP Sciences] [Google Scholar]
- García-Zamora, E. M., Torres, S., & Rebassa-Mansergas, A. 2023, A&A, 679, A127 [NASA ADS] [CrossRef] [EDP Sciences] [Google Scholar]
- García-Zamora, E. M., Torres, S., Rebassa-Mansergas, A., & Ferrer-Burjachs, A. 2025, A&A, 699, A3 [NASA ADS] [CrossRef] [EDP Sciences] [Google Scholar]
- Gentile Fusillo, N. P., Tremblay, P.-E., Gänsicke, B. T., et al. 2019, MNRAS, 482, 4570 [Google Scholar]
- Gentile Fusillo, N. P., Tremblay, P.-E., Bohlin, R. C., Deustua, S. E., & Kalirai, J. S. 2020, MNRAS, 491, 3613 [NASA ADS] [CrossRef] [Google Scholar]
- Gentile Fusillo, N. P., Tremblay, P. E., Cukanovaite, E., et al. 2021, MNRAS, 508, 3877 [NASA ADS] [CrossRef] [Google Scholar]
- Green, G. 2018, J. Open Source Softw., 3, 695 [NASA ADS] [CrossRef] [Google Scholar]
- Hollands, M. A., Tremblay, P. E., Gänsicke, B. T., Gentile-Fusillo, N. P., & Toonen, S. 2018, MNRAS, 480, 3942 [NASA ADS] [CrossRef] [Google Scholar]
- Hunter, J. D. 2007, Comput. Sci. Eng., 9, 90 [NASA ADS] [CrossRef] [Google Scholar]
- Isern, J., Torres, S., & Rebassa-Mansergas, A. 2022, Front. Astron. Space Sci., 9, 6 [NASA ADS] [CrossRef] [Google Scholar]
- Jiménez-Esteban, F. M., Torres, S., Rebassa-Mansergas, A., et al. 2023, MNRAS, 518, 5106 [Google Scholar]
- Jiménez-Esteban, F. M., Torres, S., Rebassa-Mansergas, A., et al. 2018, MNRAS, 480, 4505 [Google Scholar]
- Jin, S., Trager, S. C., Dalton, G. B., et al. 2024, MNRAS, 530, 2688 [NASA ADS] [CrossRef] [Google Scholar]
- Kao, M. L., Hawkins, K., Rogers, L. K., et al. 2024, ApJ, 970, 181 [NASA ADS] [CrossRef] [Google Scholar]
- Kepler, S. O., Pelisoli, I., Koester, D., et al. 2019, MNRAS, 486, 2169 [NASA ADS] [Google Scholar]
- Kilic, M., Bergeron, P., Kosakowski, A., et al. 2020, ApJ, 898, 84 [Google Scholar]
- Kilic, M., Bergeron, P., Blouin, S., et al. 2025, ApJ, 979, 157 [Google Scholar]
- Koester, D., & Knist, S. 2006, A&A, 454, 951 [NASA ADS] [CrossRef] [EDP Sciences] [Google Scholar]
- Kollmeier, J. A., Zasowski, G., Rix, H.-W., et al. 2017, arXiv e-prints [arXiv:1711.03234] [Google Scholar]
- Limoges, M. M., Bergeron, P., & Lépine, S. 2015, ApJS, 219, 19 [NASA ADS] [CrossRef] [Google Scholar]
- Lindegren, L., Klioner, S. A., Hernandez, J., et al. 2021, A&A, 649, A2 [NASA ADS] [CrossRef] [EDP Sciences] [Google Scholar]
- Lochner, M., & Bassett, B. A. 2021, Astron. Comput., 36, 100481 [NASA ADS] [CrossRef] [Google Scholar]
- López-Sanjuan, C., Tremblay, P. E., Ederoclite, A., et al. 2022a, A&A, 658, A79 [NASA ADS] [CrossRef] [EDP Sciences] [Google Scholar]
- López-Sanjuan, C., Tremblay, P. E., Ederoclite, A., et al. 2022b, A&A, 665, A151 [NASA ADS] [CrossRef] [EDP Sciences] [Google Scholar]
- López-Sanjuan, C., Tremblay, P. E., O’Brien, M. W., et al. 2024a, A&A, 691, A211 [NASA ADS] [CrossRef] [EDP Sciences] [Google Scholar]
- López-Sanjuan, C., Vazquez Ramió, H., Xiao, K., et al. 2024b, A&A, 683, A29 [NASA ADS] [CrossRef] [EDP Sciences] [Google Scholar]
- Malanchev, K. L., Pruzhinskaya, M. V., Korolev, V. S., et al. 2021, MNRAS, 502, 5147 [Google Scholar]
- Manser, C. J., Izquierdo, P., Gänsicke, B. T., et al. 2024, MNRAS, 535, 254 [CrossRef] [Google Scholar]
- Margalef-Bentabol, B., Huertas-Company, M., Charnock, T., et al. 2020, MNRAS, 496, 2346 [Google Scholar]
- Marín-Franch, A., Taylor, K., Cenarro, J., Cristobal-Hornillos, D., & Moles, M. 2015, in IAU General Assembly, 29, 2257381 [Google Scholar]
- McCleery, J., Tremblay, P.-E., Gentile Fusillo, N. P., et al. 2020, MNRAS, 499, 1890 [Google Scholar]
- McInnes, L., Healy, J., & Melville, J. 2018, arXiv e-prints [arXiv: 1802.03426] [Google Scholar]
- Mendes de Oliveira, C., Ribeiro, T., Schoenell, W., et al. 2019, MNRAS, 489, 241 [NASA ADS] [CrossRef] [Google Scholar]
- Mesarcik, M., Boonstra, A. J., Iacobelli, M., et al. 2023, A&A, 680, A74 [NASA ADS] [CrossRef] [EDP Sciences] [Google Scholar]
- Montegriffo, P., De Angeli, F., Andrae, R., et al. 2023, A&A, 674, A3 [NASA ADS] [CrossRef] [EDP Sciences] [Google Scholar]
- Muthukrishna, D., Mandel, K. S., Lochner, M., Webb, S., & Narayan, G. 2022, MNRAS, 517, 393 [NASA ADS] [CrossRef] [Google Scholar]
- O’Brien, M. W., Tremblay, P. E., Gentile Fusillo, N. P., et al. 2023, MNRAS, 518, 3055 [Google Scholar]
- O’Brien, M. W., Tremblay, P. E., Klein, B. L., et al. 2024, MNRAS, 527, 8687 [Google Scholar]
- Oke, J. B., & Gunn, J. E. 1983, ApJ, 266, 713 [NASA ADS] [CrossRef] [Google Scholar]
- Pérez-Couto, X., Manteiga, M., & Villaver, E. 2025, ApJ, 988, 51 [Google Scholar]
- Pérez-Couto, X., Pallas-Quintela, L., Manteiga, M., Villaver, E., & Dafonte, C. 2024, ApJ, 977, 31 [Google Scholar]
- Rebassa-Mansergas, A., Gänsicke, B. T., Schreiber, M. R., Koester, D., & Rodríguez-Gil, P. 2010, MNRAS, 402, 620 [Google Scholar]
- Rebassa-Mansergas, A., Nebot Gómez-Morán, A., Schreiber, M. R., et al. 2012, MNRAS, 419, 806 [NASA ADS] [CrossRef] [Google Scholar]
- Rebassa-Mansergas, A., Ren, J. J., Parsons, S. G., et al. 2016, MNRAS, 458, 3808 [NASA ADS] [CrossRef] [Google Scholar]
- Ren, J. J., Rebassa-Mansergas, A., Parsons, S. G., et al. 2018, MNRAS, 477, 4641 [NASA ADS] [CrossRef] [Google Scholar]
- Singal, J., Silverman, G., Jones, E., et al. 2022, ApJ, 928, 6 [NASA ADS] [CrossRef] [Google Scholar]
- Sion, E. M., Greenstein, J. L., Landstreet, J. D., et al. 1983, ApJ, 269, 253 [CrossRef] [Google Scholar]
- Storey-Fisher, K., Huertas-Company, M., Ramachandra, N., et al. 2021, MNRAS, 508, 2946 [NASA ADS] [CrossRef] [Google Scholar]
- Tanaka, T. S., Shimakawa, R., Shimasaku, K., et al. 2022, PASJ, 74, 1 [Google Scholar]
- Torres, S., Cruz, P., Murillo-Ojeda, R., et al. 2023, A&A, 677, A159 [NASA ADS] [CrossRef] [EDP Sciences] [Google Scholar]
- Tremblay, P. E., Bergeron, P., & Gianninas, A. 2011, ApJ, 730, 128 [Google Scholar]
- Tremblay, P. E., Ludwig, H. G., Steffen, M., & Freytag, B. 2013, A&A, 559, A104 [NASA ADS] [CrossRef] [EDP Sciences] [Google Scholar]
- Tremblay, P. E., Gianninas, A., Kilic, M., et al. 2015, ApJ, 809, 148 [NASA ADS] [CrossRef] [Google Scholar]
- Tremblay, P. E., Hollands, M. A., Gentile Fusillo, N. P., et al. 2020, MNRAS, 497, 130 [NASA ADS] [CrossRef] [Google Scholar]
- Tremblay, P.-E., Bédard, A., O’Brien, M. W., et al. 2024, New A Rev., 99, 101705 [Google Scholar]
- Vincent, O., Bergeron, P., & Lafrenière, D. 2020, AJ, 160, 252 [NASA ADS] [CrossRef] [Google Scholar]
- Vincent, O., Bergeron, P., & Dufour, P. 2023, MNRAS, 521, 760 [NASA ADS] [CrossRef] [Google Scholar]
- Vincent, O., Barstow, M. A., Jordan, S., et al. 2024, A&A, 682, A5 [NASA ADS] [CrossRef] [EDP Sciences] [Google Scholar]
- Vincent, O., Bergeron, P., & Dufour, P. 2025, MNRAS, 538, 2233 [Google Scholar]
- Wenger, M., Ochsenbein, F., Egret, D., et al. 2000, A&AS, 143, 9 [NASA ADS] [CrossRef] [EDP Sciences] [Google Scholar]
- Yuan, H. B., Liu, X. W., & Xiang, M. S. 2013, MNRAS, 430, 2188 [NASA ADS] [CrossRef] [Google Scholar]
- Zhang, X., Green, G. M., & Rix, H.-W. 2023, MNRAS, 524, 1855 [NASA ADS] [CrossRef] [Google Scholar]
The aperture corrections can be derived from the table jplus.FNuDualPointSources in the J-PLUS database, and their estimation is detailed in López-Sanjuan et al. (2022a).
Accessible in the table jplus.Filter of the J-PLUS database.
For completeness, the median residual in the other J-PLUS passbands are presented in Appendix B.
All Tables
All Figures
|
Fig. 1 Spectral energy distributions of four white dwarfs analyzed in this work. The colored points in all panels represent the J-PLUS 3-arcsec-diameter photometry, corrected for aperture effects. Broad-band filters (u, ɡ, r, i, z) are shown as squares, whereas narrow- and medium-band filters (J0378, J0395, J0410, J0430, J0515, J0660, J0861) are shown as circles. The best-fitting solution is indicated gray diamonds connected with a solid line, with the derived parameters and their uncertainties labeled in the panels: effective temperature (Teff), surface gravity (log g), and parallax (ϖ). The unique J-PLUS identification, composed of the TILE_ID of the reference r-band image and the NUMBER assigned by SExtractor to the source, is also reported in the panels for reference. Top panels: all passbands were used in the SED-fitting process, and the probability of having an H-dominated atmosphere (pH) is provided. Bottom panels: the equivalent width in the J0395 (EWJ0395) was computed to identify the presence of calcium absorption, using the expected continuum from the SED-fitting to the other eleven passbands (white diamond) as reference. These two sources have a probability of calcium absorption of pCa = 1. |
| In the text | |
|
Fig. 2 Extinction coefficients of the J-PLUS passbands scaled by 0.965 (circles). The solid line depicts the extinction curve derived by Zhang et al. (2023) in the optical range. |
| In the text | |
|
Fig. 3 Fraction of He-dominated white dwarfs (ƒHe) as a function of effective temperature (Teff). The solid red line represents the result from López-Sanjuan et al. (2022a) and corresponds to the prior used in Sect. 3.2. Measurements from Torres et al. (2023), using Gaia BP/RP spectra (hexagons), and from Kilic et al. (2025), using the 100 pc spectroscopic sample (squares), are also shown. |
| In the text | |
|
Fig. 4 Sky distribution of the 14 844 white dwarfs in the J-PLUS DR3 catalog. The solid line depicts the position of the Milky Way disk, and the dashed lines correspond to ±10 deg in Galactic latitude. |
| In the text | |
|
Fig. 5 Probability distribution function of the parallax (ϖ) for H-dominated (hatched, orange) and He-dominated (solid, purple) atmospheres in the final J-PLUS DR3 catalog. |
| In the text | |
|
Fig. 6 Signal-to-noise ratio in the Gaia EDR3 parallax ( |
| In the text | |
|
Fig. 7 Stacked histogram in |
| In the text | |
|
Fig. 8 Distribution of χ2 values for the white dwarf sample (black histograms). The red lines represent the theoretical χ2 distribution with 10 degrees of freedom. The right panel shows the same data with the y-axis in logarithmic scale and an expanded x-axis range. The green histogram highlights the 771 outlier sources with χ2 ≥ 23.2. |
| In the text | |
|
Fig. 9 Two-dimensional UMAP manifold of the J-PLUS 12-dimensional residuals space, (ƒ − ƒbest)/σƒ. Top-left panel: distribution of the full sample (black dots). Top-right panel: distribution of the sources with χ2 < 23.2, as shown in the color scale. Bottom-left panel: distribution of the outliers with χ2 ≥ 23.2. Bottom-right panel: definition of the three types of outliers (Tout), as indicated in the color bar. |
| In the text | |
|
Fig. 10 Relative fraction of each outlier type, ƒout, as a function of χ2. The blue, green, and red lines depict ƒout for Tout = 1, 2, and 3, respectively. |
| In the text | |
|
Fig. 11 Normalized residuals for the different J-PLUS photometric bands, as labeled on the x-axis. The median and the dispersion of the best Gaussian describing the residuals of the population are shown with the symbols and the error bars, respectively. The solid black line depicts a zero difference, and the shaded region represents the expected range for a random distribution. The top panel corresponds to the outlier type Tout = 0 and the bottom panel to Tout = 1. |
| In the text | |
|
Fig. 12 Two-dimensional UMAP manifold for the J-PLUS 12-dimensional residuals space. Top panel: distribution of the outliers color-coded by their pCa. Bottom panel: distribution of all sources with pCa > 0.5 color-coded with Tout. |
| In the text | |
|
Fig. 13 Same as shown in Fig. 11, but for white dwarfs with Tout = 2 (top panel), Tout = 1 and pCa > 0.5 (middle panel), and Tout = 0 and pCa > 0.5 (bottom panel). The dashed lines depicts the median points in the Tout = 2 case for reference. |
| In the text | |
|
Fig. 14 Median value of the normalized residuals in the J0395 pass-band along the UMAP two-dimensional manifold. |
| In the text | |
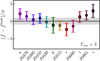 |
Fig. 15 Same as shown in Fig. 11, but for white dwarfs with Tout = 3. |
| In the text | |
|
Fig. 16 Probability distribution function of the estimated stellar mass for sources with Tout = 1 (empty histogram), Tout = 2 (hatched histogram), and Tout = 3 (filled histogram). |
| In the text | |
|
Fig. 17 Same as Fig. 1, but for two white dwarfs with Tout = 3, M > 0.45 M⊙, and spectroscopically classified as DQ. The SDSS spectrum of the source is shown with the brown solid line. |
| In the text | |
|
Fig. 18 Carbon-to-helium abundance ratio (C/He) as a function of Teff for DQs with spectroscopic measurements and Tout = 0 (black circles), Tout = 1 (blue squares), and Tout = 3 (green stars). |
| In the text | |
|
Fig. 19 Mean probability from machine learning classification as a function of the mean probability from J-PLUS. Circles and squares show the results from SDSS DR17 spectra (Vincent et al. 2023, Sect. 5.1.1) and Gaia BP/RP spectra (Vincent et al. 2024, Sect. 5.2.1), respectively. The dotted line marks the one-to-one relation. Top panel: PDA as a function of pH- Bottom panel: PDZ as a function of pCa. |
| In the text | |
|
Fig. 20 Probability distribution function of DZ white dwarfs from SDSS DR17 in pCa for three different S/N selections in EWJ0395: S/N ≥ 3 (purple), 1.5 ≤ S/N < 3 (black), and S/N < 1.5 (red). |
| In the text | |
|
Fig. 21 Fraction of white dwarfs classified as DA as a function of pH. Squares and circles show the results from DESI EDR (Manser et al. 2024, Sect. 5.1.2) and Gaia BP/RP spectra (García-Zamora et al. 2023, Sect. 5.2.2), respectively. The dotted line marks the one-to-one relation. |
| In the text | |
|
Fig. 22 Manifold generated with UMAP from Kao et al. (2024), based on Gaia BP/RP spectral coefficients. Symbols represent different J-PLUS classes: H-dominated atmosphere (cyan circles), He-dominated atmospheres (yellow triangles), metal-polluted atmospheres (pCa > 0.5 or Tout = 2; red diamonds), and Tout = 3 sources (green stars). |
| In the text | |
|
Fig. B.1 Median value of the normalized residuals along the UMAP two-dimensional manifold for the u, J0378, J0410, J0430, ɡ, J0515, r, J0660, i, J0861, and z passbands, from top to bottom and left to right. |
| In the text | |
Current usage metrics show cumulative count of Article Views (full-text article views including HTML views, PDF and ePub downloads, according to the available data) and Abstracts Views on Vision4Press platform.
Data correspond to usage on the plateform after 2015. The current usage metrics is available 48-96 hours after online publication and is updated daily on week days.
Initial download of the metrics may take a while.