Open Access
Fig. 12
Download original image
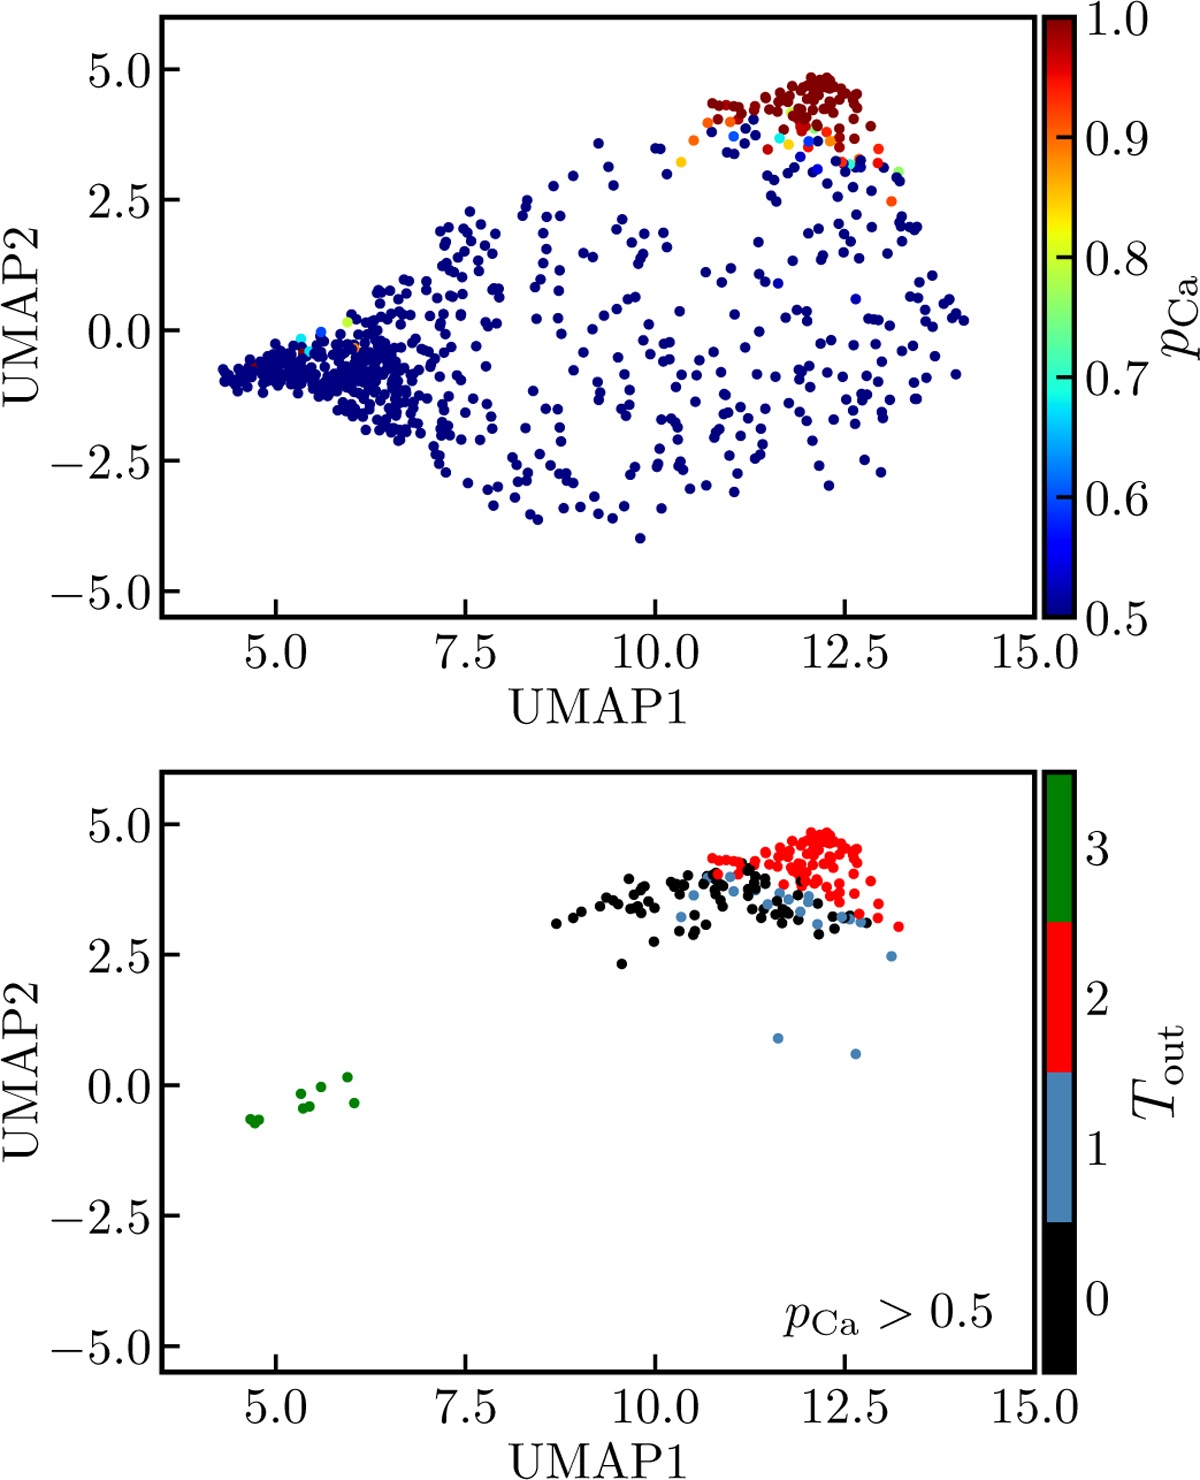
Two-dimensional UMAP manifold for the J-PLUS 12-dimensional residuals space. Top panel: distribution of the outliers color-coded by their pCa. Bottom panel: distribution of all sources with pCa > 0.5 color-coded with Tout.
Current usage metrics show cumulative count of Article Views (full-text article views including HTML views, PDF and ePub downloads, according to the available data) and Abstracts Views on Vision4Press platform.
Data correspond to usage on the plateform after 2015. The current usage metrics is available 48-96 hours after online publication and is updated daily on week days.
Initial download of the metrics may take a while.