Fig. 8
Download original image
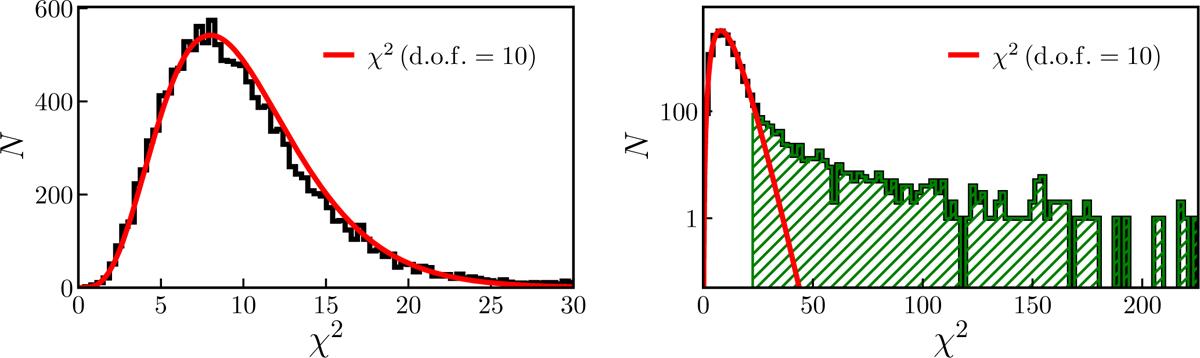
Distribution of χ2 values for the white dwarf sample (black histograms). The red lines represent the theoretical χ2 distribution with 10 degrees of freedom. The right panel shows the same data with the y-axis in logarithmic scale and an expanded x-axis range. The green histogram highlights the 771 outlier sources with χ2 ≥ 23.2.
Current usage metrics show cumulative count of Article Views (full-text article views including HTML views, PDF and ePub downloads, according to the available data) and Abstracts Views on Vision4Press platform.
Data correspond to usage on the plateform after 2015. The current usage metrics is available 48-96 hours after online publication and is updated daily on week days.
Initial download of the metrics may take a while.