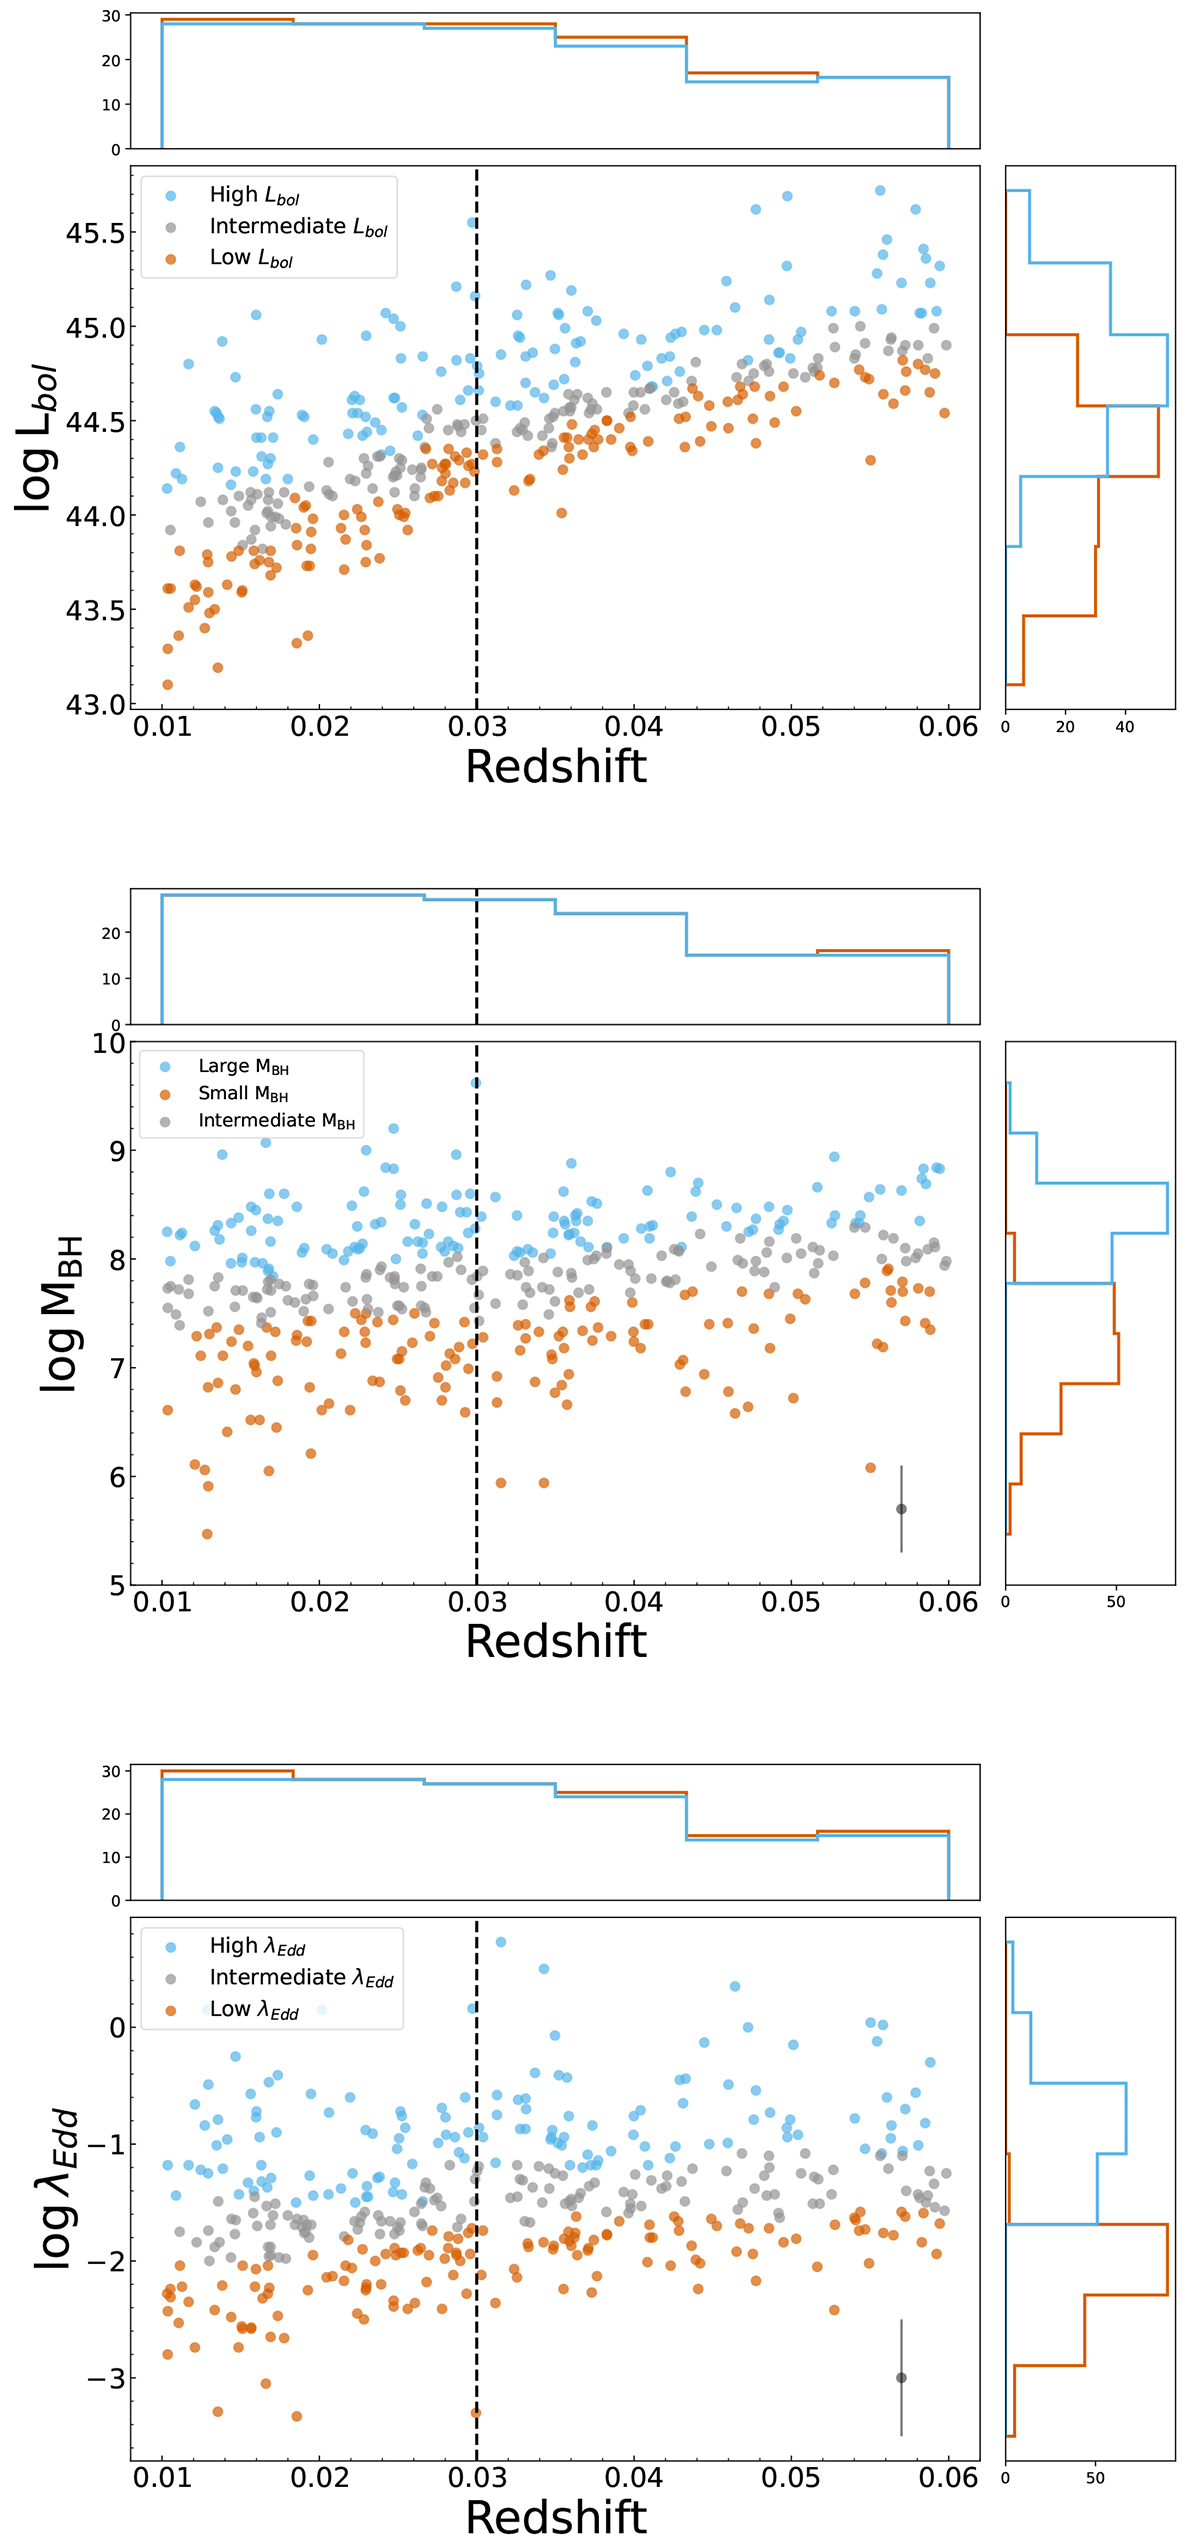
Fig. 1.
Download original image
AGN parameters (luminosity, black hole mass, and Eddington ratio) vs. redshift for the BASS AGN sample used in our kNN analysis. We categorized the parameter bins into large (sky blue) and small (orange) subsamples to have similar redshift distributions. For each plot, the top histogram shows the redshift distribution of the two bins and the rightward histogram shows the parameter distribution. Luminosity bins are shown at the top, black hole mass bins are in the middle, and Eddington ratio bins are at the bottom. We show the typical parameter uncertainties in the bottom right.
Current usage metrics show cumulative count of Article Views (full-text article views including HTML views, PDF and ePub downloads, according to the available data) and Abstracts Views on Vision4Press platform.
Data correspond to usage on the plateform after 2015. The current usage metrics is available 48-96 hours after online publication and is updated daily on week days.
Initial download of the metrics may take a while.