Fig. 12.
Download original image
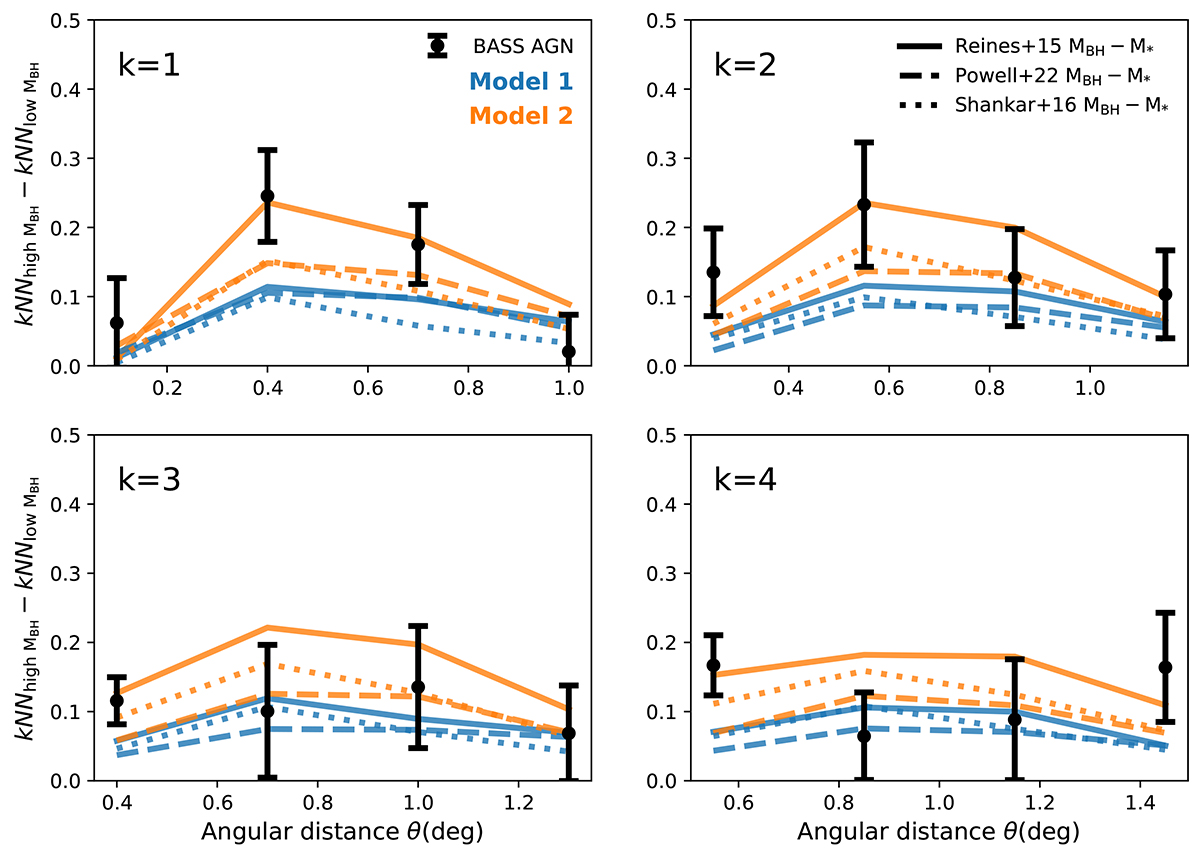
Differences between the high-mass and low-mass CDFs for the first 4 neighbors. The BASS measurements (black data points) are compared to two toy models: model 1 (blue), which assumes standard MBH − M* and M* − Mhalo relations, and model 2 (orange), which additionally includes a MBH − Mhalo correlation at fixed M*. Different line styles correspond to different assumptions for the MBH − M* relation.
Current usage metrics show cumulative count of Article Views (full-text article views including HTML views, PDF and ePub downloads, according to the available data) and Abstracts Views on Vision4Press platform.
Data correspond to usage on the plateform after 2015. The current usage metrics is available 48-96 hours after online publication and is updated daily on week days.
Initial download of the metrics may take a while.