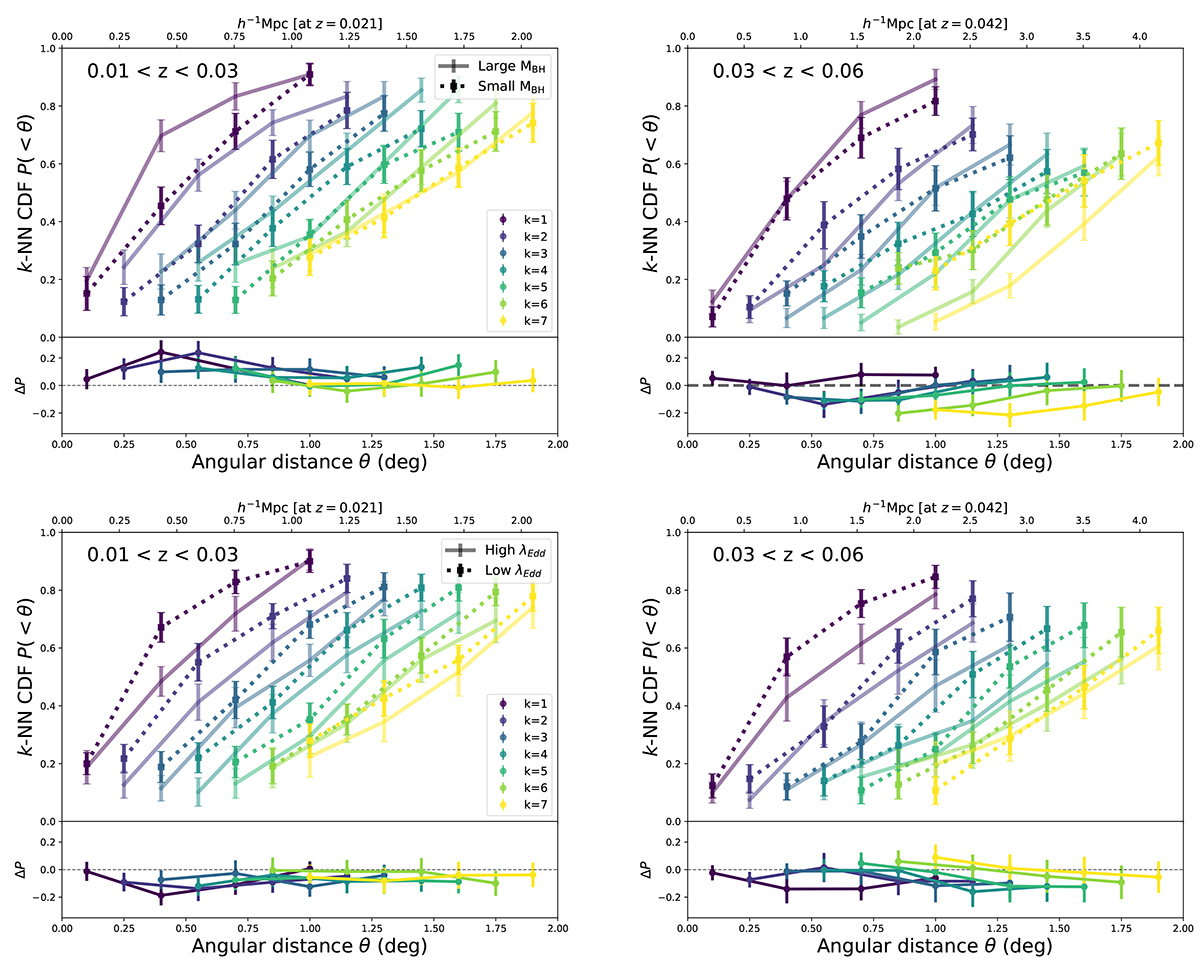
Fig. C.1.
Download original image
kNN CDFs as a function of black hole mass (top) and Eddington ratio (bottom), using values derived from stellar velocity dispersion measurements (Caglar et al. 2023). Left plots show results for AGN in the low-redshift range, and right panels show the higher redshift range. The color scheme is the same as in Figs. 4, 5 and 6, and differences are again shown in the bottom panels.
Current usage metrics show cumulative count of Article Views (full-text article views including HTML views, PDF and ePub downloads, according to the available data) and Abstracts Views on Vision4Press platform.
Data correspond to usage on the plateform after 2015. The current usage metrics is available 48-96 hours after online publication and is updated daily on week days.
Initial download of the metrics may take a while.