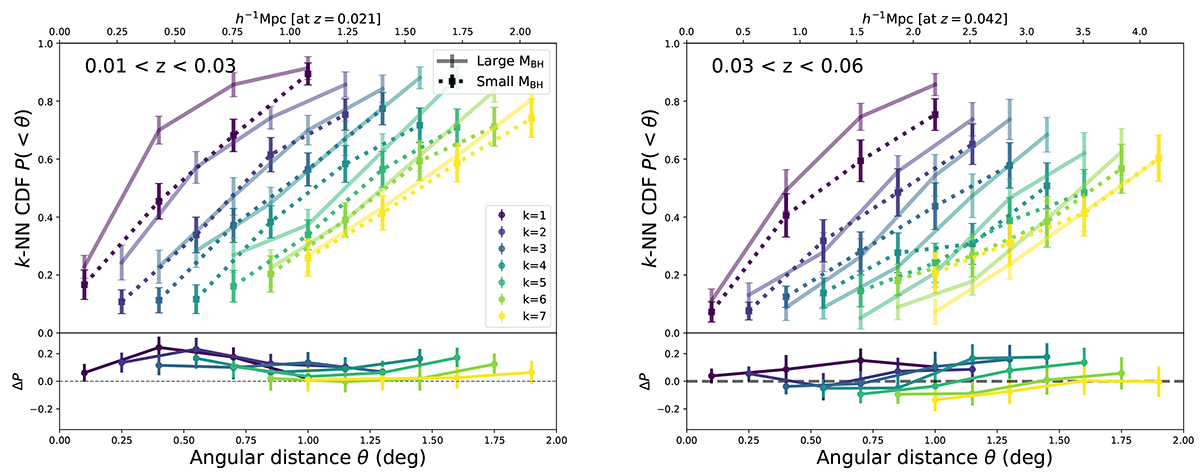
Fig. 5.
Download original image
kNN CDFs of the two black hole mass bins for the low redshift range (left) and higher redshift range (right). The solid lines correspond to the high-BH mass AGN and the dashed lines represent the low-BH mass subsample. The color scheme is the same as in Fig. 4, and the differences between the high- and low-MBH CDFs are shown in the bottom panels.
Current usage metrics show cumulative count of Article Views (full-text article views including HTML views, PDF and ePub downloads, according to the available data) and Abstracts Views on Vision4Press platform.
Data correspond to usage on the plateform after 2015. The current usage metrics is available 48-96 hours after online publication and is updated daily on week days.
Initial download of the metrics may take a while.