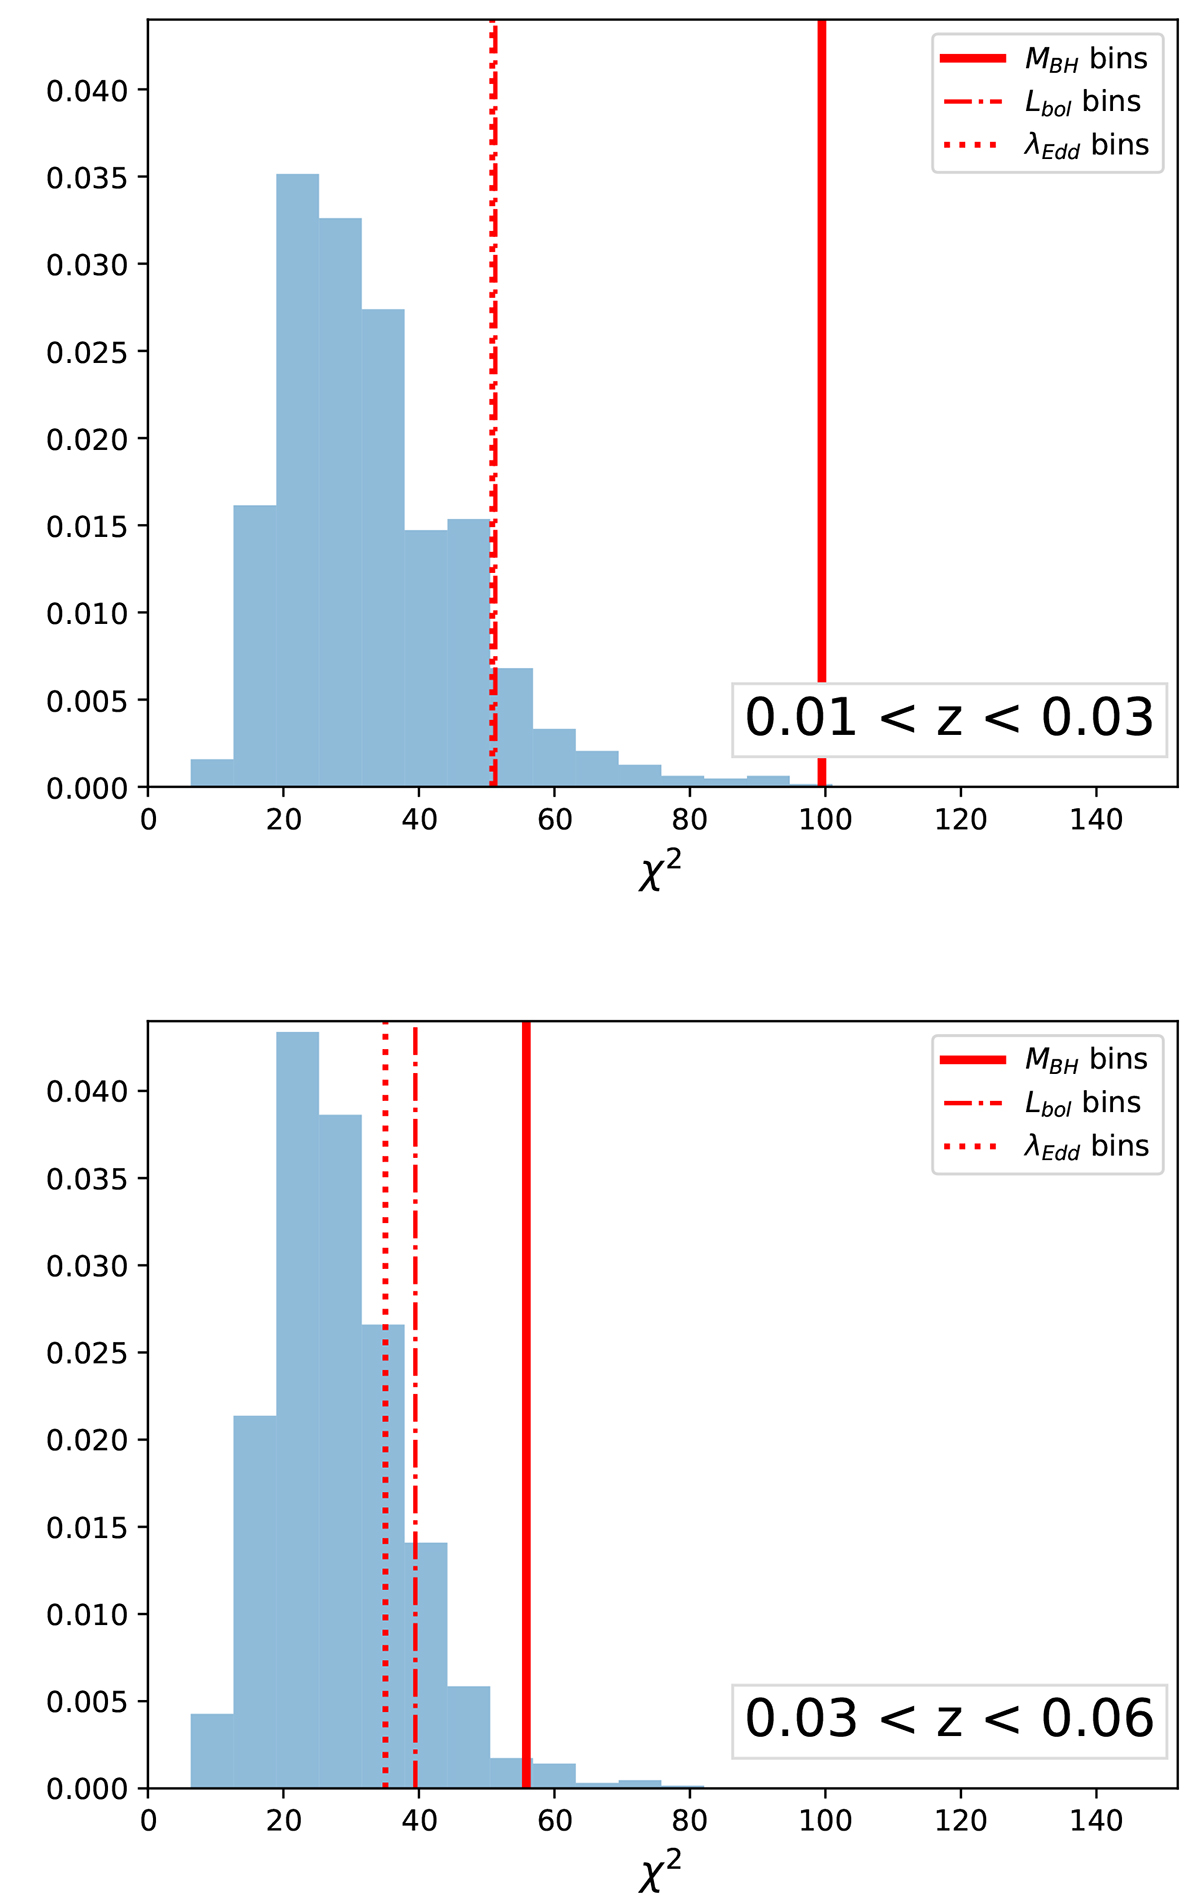
Fig. 7.
Download original image
Comparison of our chi-squared values for each binning configuration (red lines) with the null distribution (blue histograms). The latter was obtained by randomly splitting the AGN sample into two subsamples the size of each parameter bin and comparing them. The results for our lower redshift range are shown on top, and the higher-z on the bottom.
Current usage metrics show cumulative count of Article Views (full-text article views including HTML views, PDF and ePub downloads, according to the available data) and Abstracts Views on Vision4Press platform.
Data correspond to usage on the plateform after 2015. The current usage metrics is available 48-96 hours after online publication and is updated daily on week days.
Initial download of the metrics may take a while.