Fig. 1.
Download original image
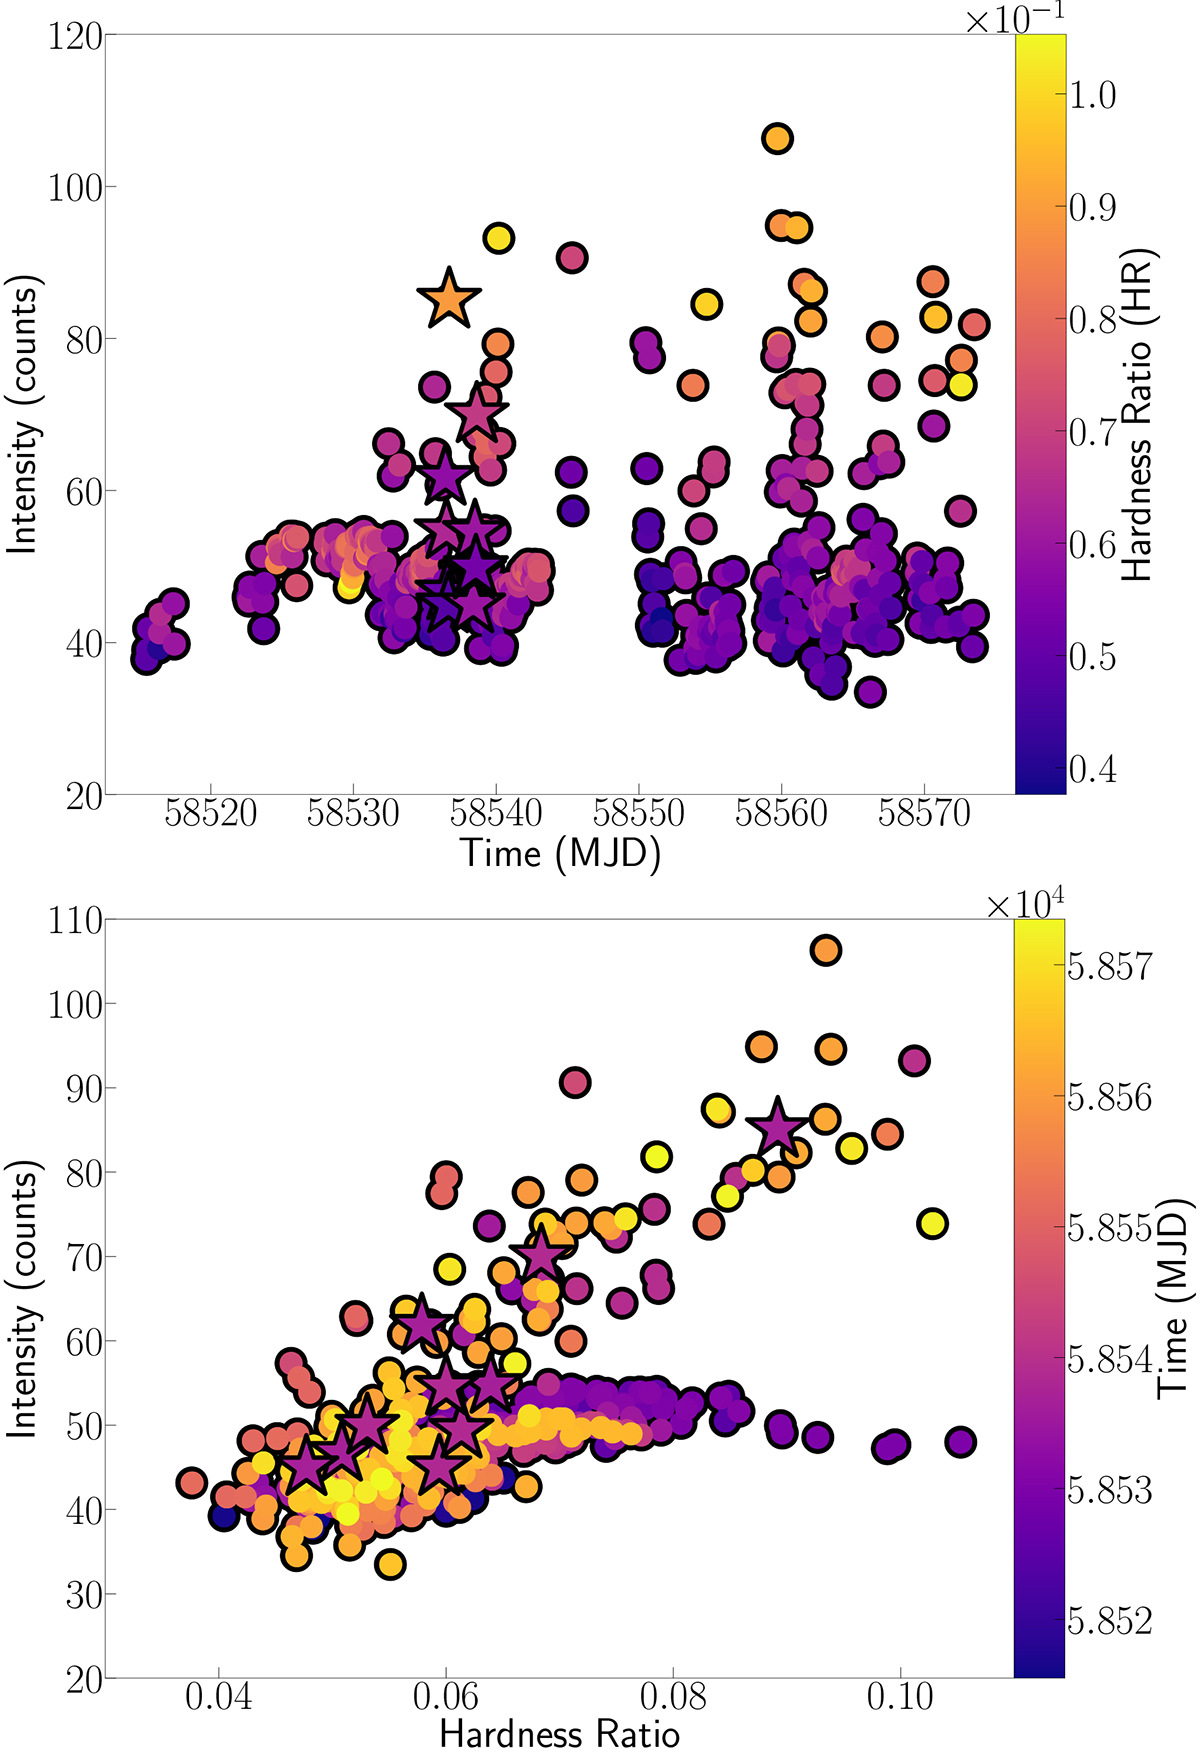
Light curve (top) and HID (bottom) of Sco X-1 using MAXI data taken from 1 February 2019 to 31 March 2019 with a time resolution of 0.04 days. The light curve is colour-coded with the HR = B/A, and the HID with the time (in MJD). Data taken from 22 February 2019 to 24 February 2019, corresponding to the multi-wavelength campaign, are represented with star markers.
Current usage metrics show cumulative count of Article Views (full-text article views including HTML views, PDF and ePub downloads, according to the available data) and Abstracts Views on Vision4Press platform.
Data correspond to usage on the plateform after 2015. The current usage metrics is available 48-96 hours after online publication and is updated daily on week days.
Initial download of the metrics may take a while.