Open Access
Fig. C.2
Download original image
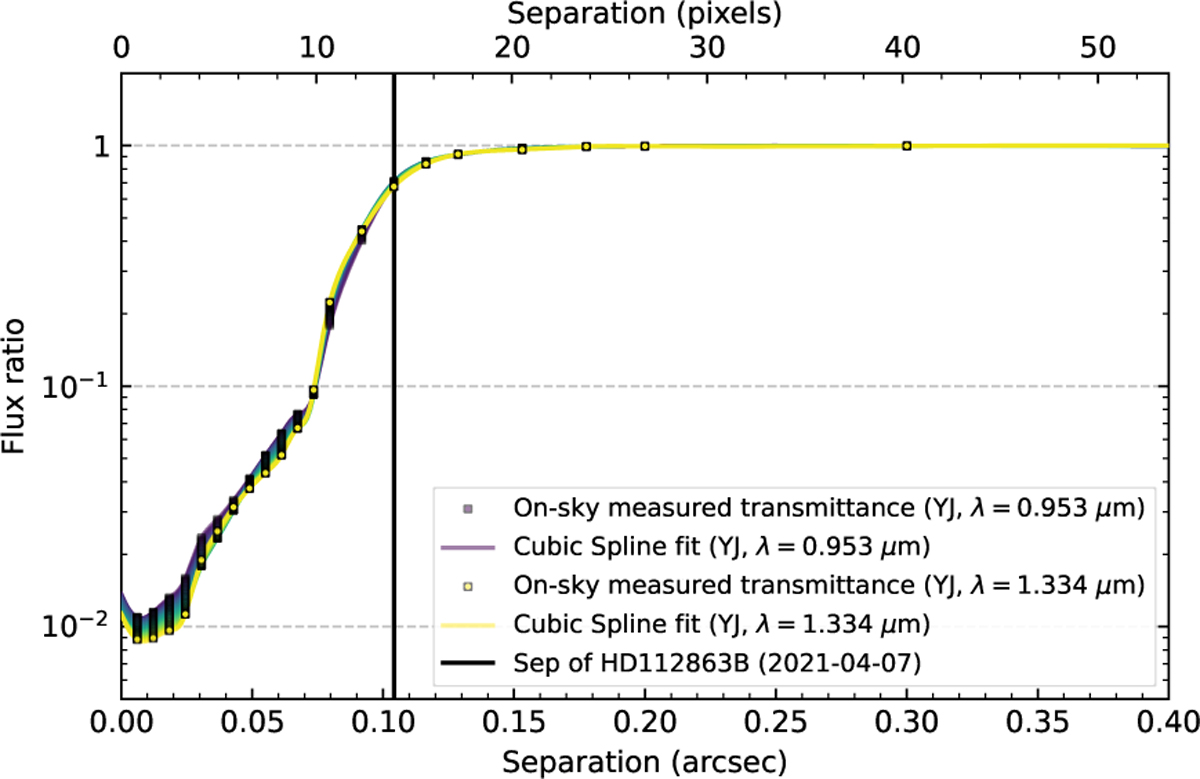
Same as Fig. C.1 but for the coronagraph transmission profiles for IFS YJ. The measurements and interpolations for the first and last wavelength of IFS YJ are highlighted.
Current usage metrics show cumulative count of Article Views (full-text article views including HTML views, PDF and ePub downloads, according to the available data) and Abstracts Views on Vision4Press platform.
Data correspond to usage on the plateform after 2015. The current usage metrics is available 48-96 hours after online publication and is updated daily on week days.
Initial download of the metrics may take a while.