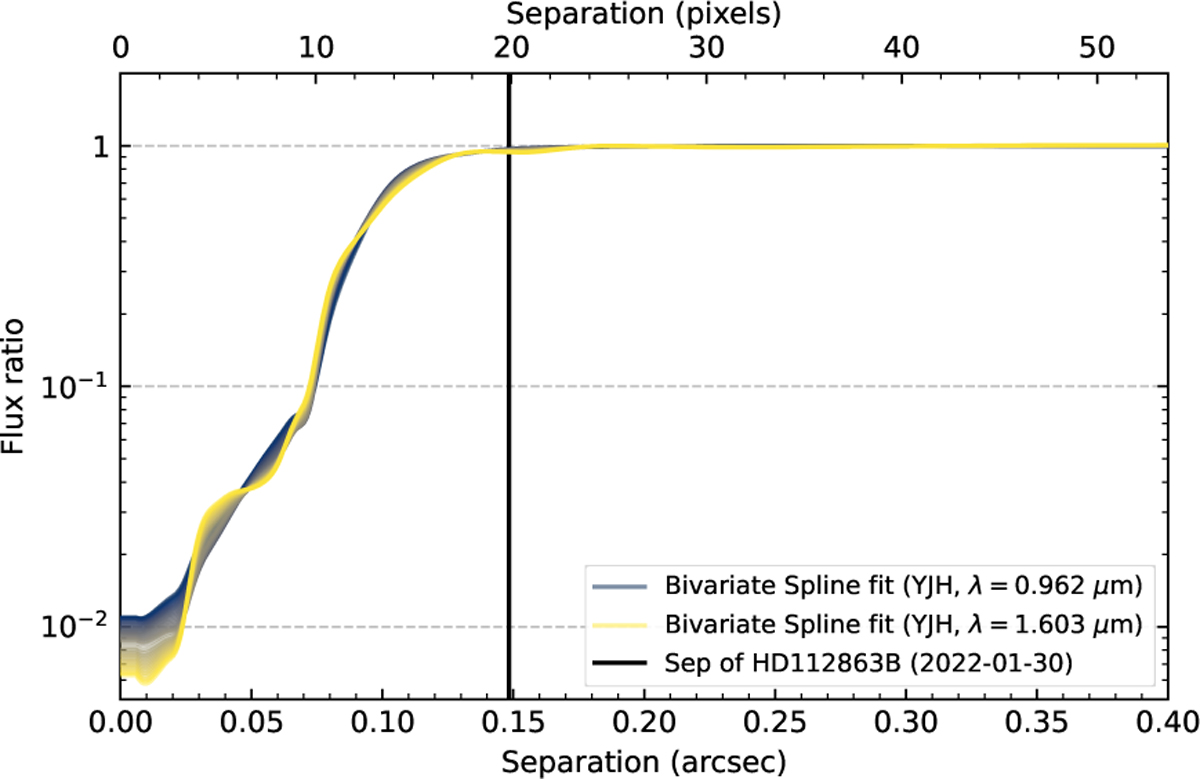
Fig. C.3
Download original image
Coronagraph transmission profiles for IFS YJH. Shown here are the results of the bivariate spline interpolation to the IFS YJ and IRDIS H23 measured values, at each of the IFS YJH wavelengths. The interpolations for the first and last wavelength of IFS YJH are highlighted. The interpolations were treated as radial profiles to create coronagraphic transmission images, in order to directly correct the HD 112863 science frames (see Sect. 3.2.2).
Current usage metrics show cumulative count of Article Views (full-text article views including HTML views, PDF and ePub downloads, according to the available data) and Abstracts Views on Vision4Press platform.
Data correspond to usage on the plateform after 2015. The current usage metrics is available 48-96 hours after online publication and is updated daily on week days.
Initial download of the metrics may take a while.