Fig. 3
Download original image
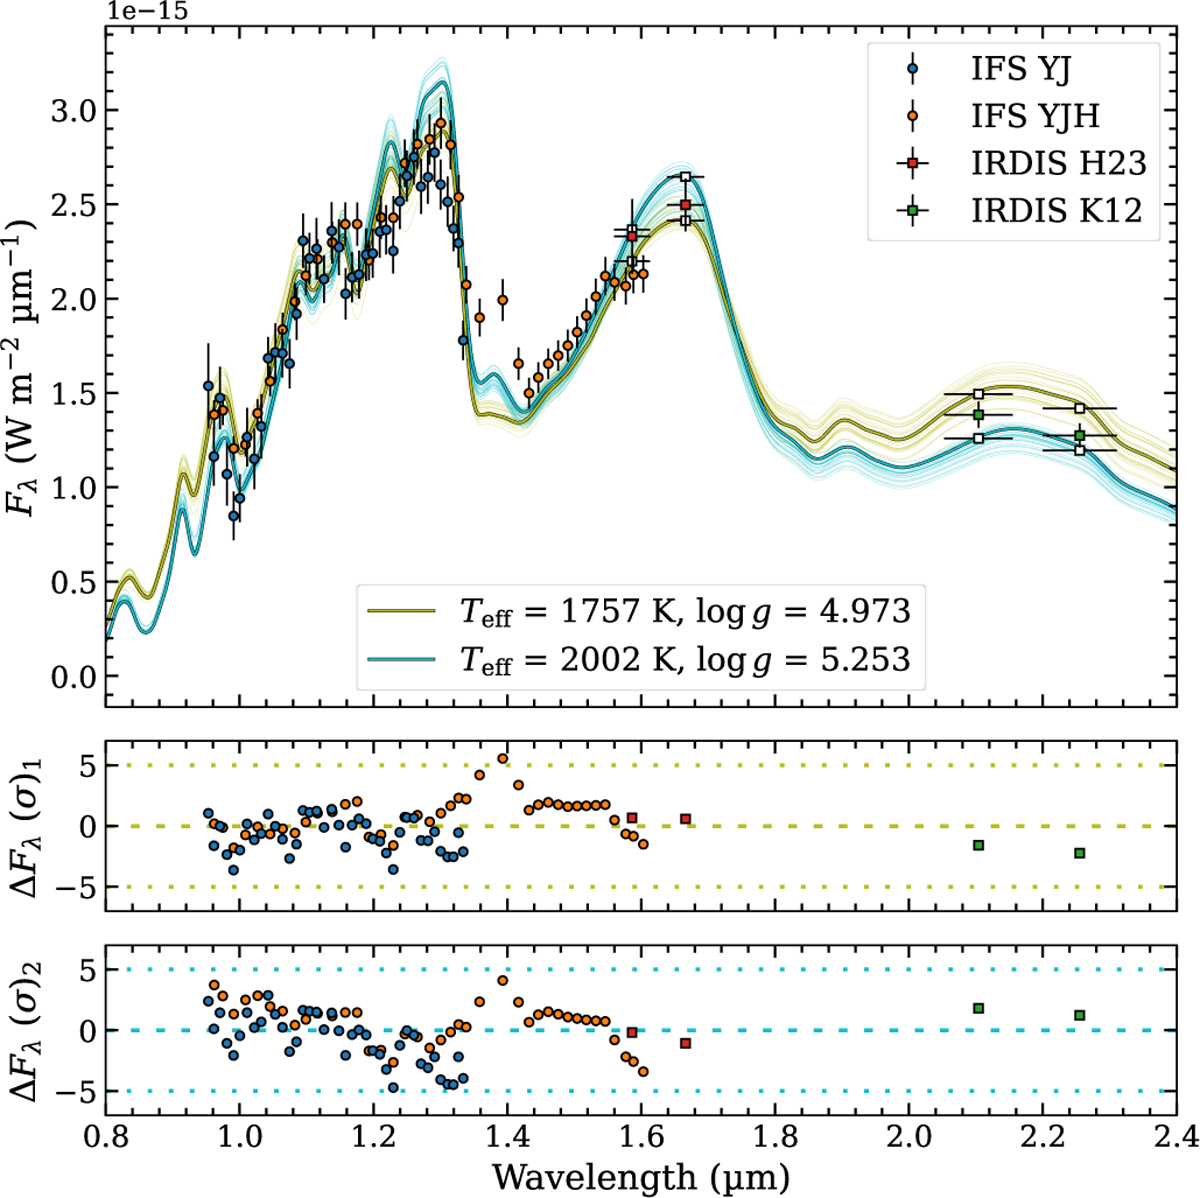
Median atmospheric model of the first mode (demarcated olive line) and the median atmospheric model of the second mode (demarcated cyan line) from the BT-Settl grid fit to the SPHERE photometry and spectroscopy of HD 112863 B (see Fig. G.1). Included are 25 models chosen randomly from the first mode (translucent olive lines) and 25 models chosen randomly from the second mode (translucent cyan lines) of the posterior distribution. The residuals between the SPHERE data and both the first mode (ΔFλ(σ)1) as well as the second mode (ΔFλ(σ)2) are shown.
Current usage metrics show cumulative count of Article Views (full-text article views including HTML views, PDF and ePub downloads, according to the available data) and Abstracts Views on Vision4Press platform.
Data correspond to usage on the plateform after 2015. The current usage metrics is available 48-96 hours after online publication and is updated daily on week days.
Initial download of the metrics may take a while.