Fig. E.1.
Download original image
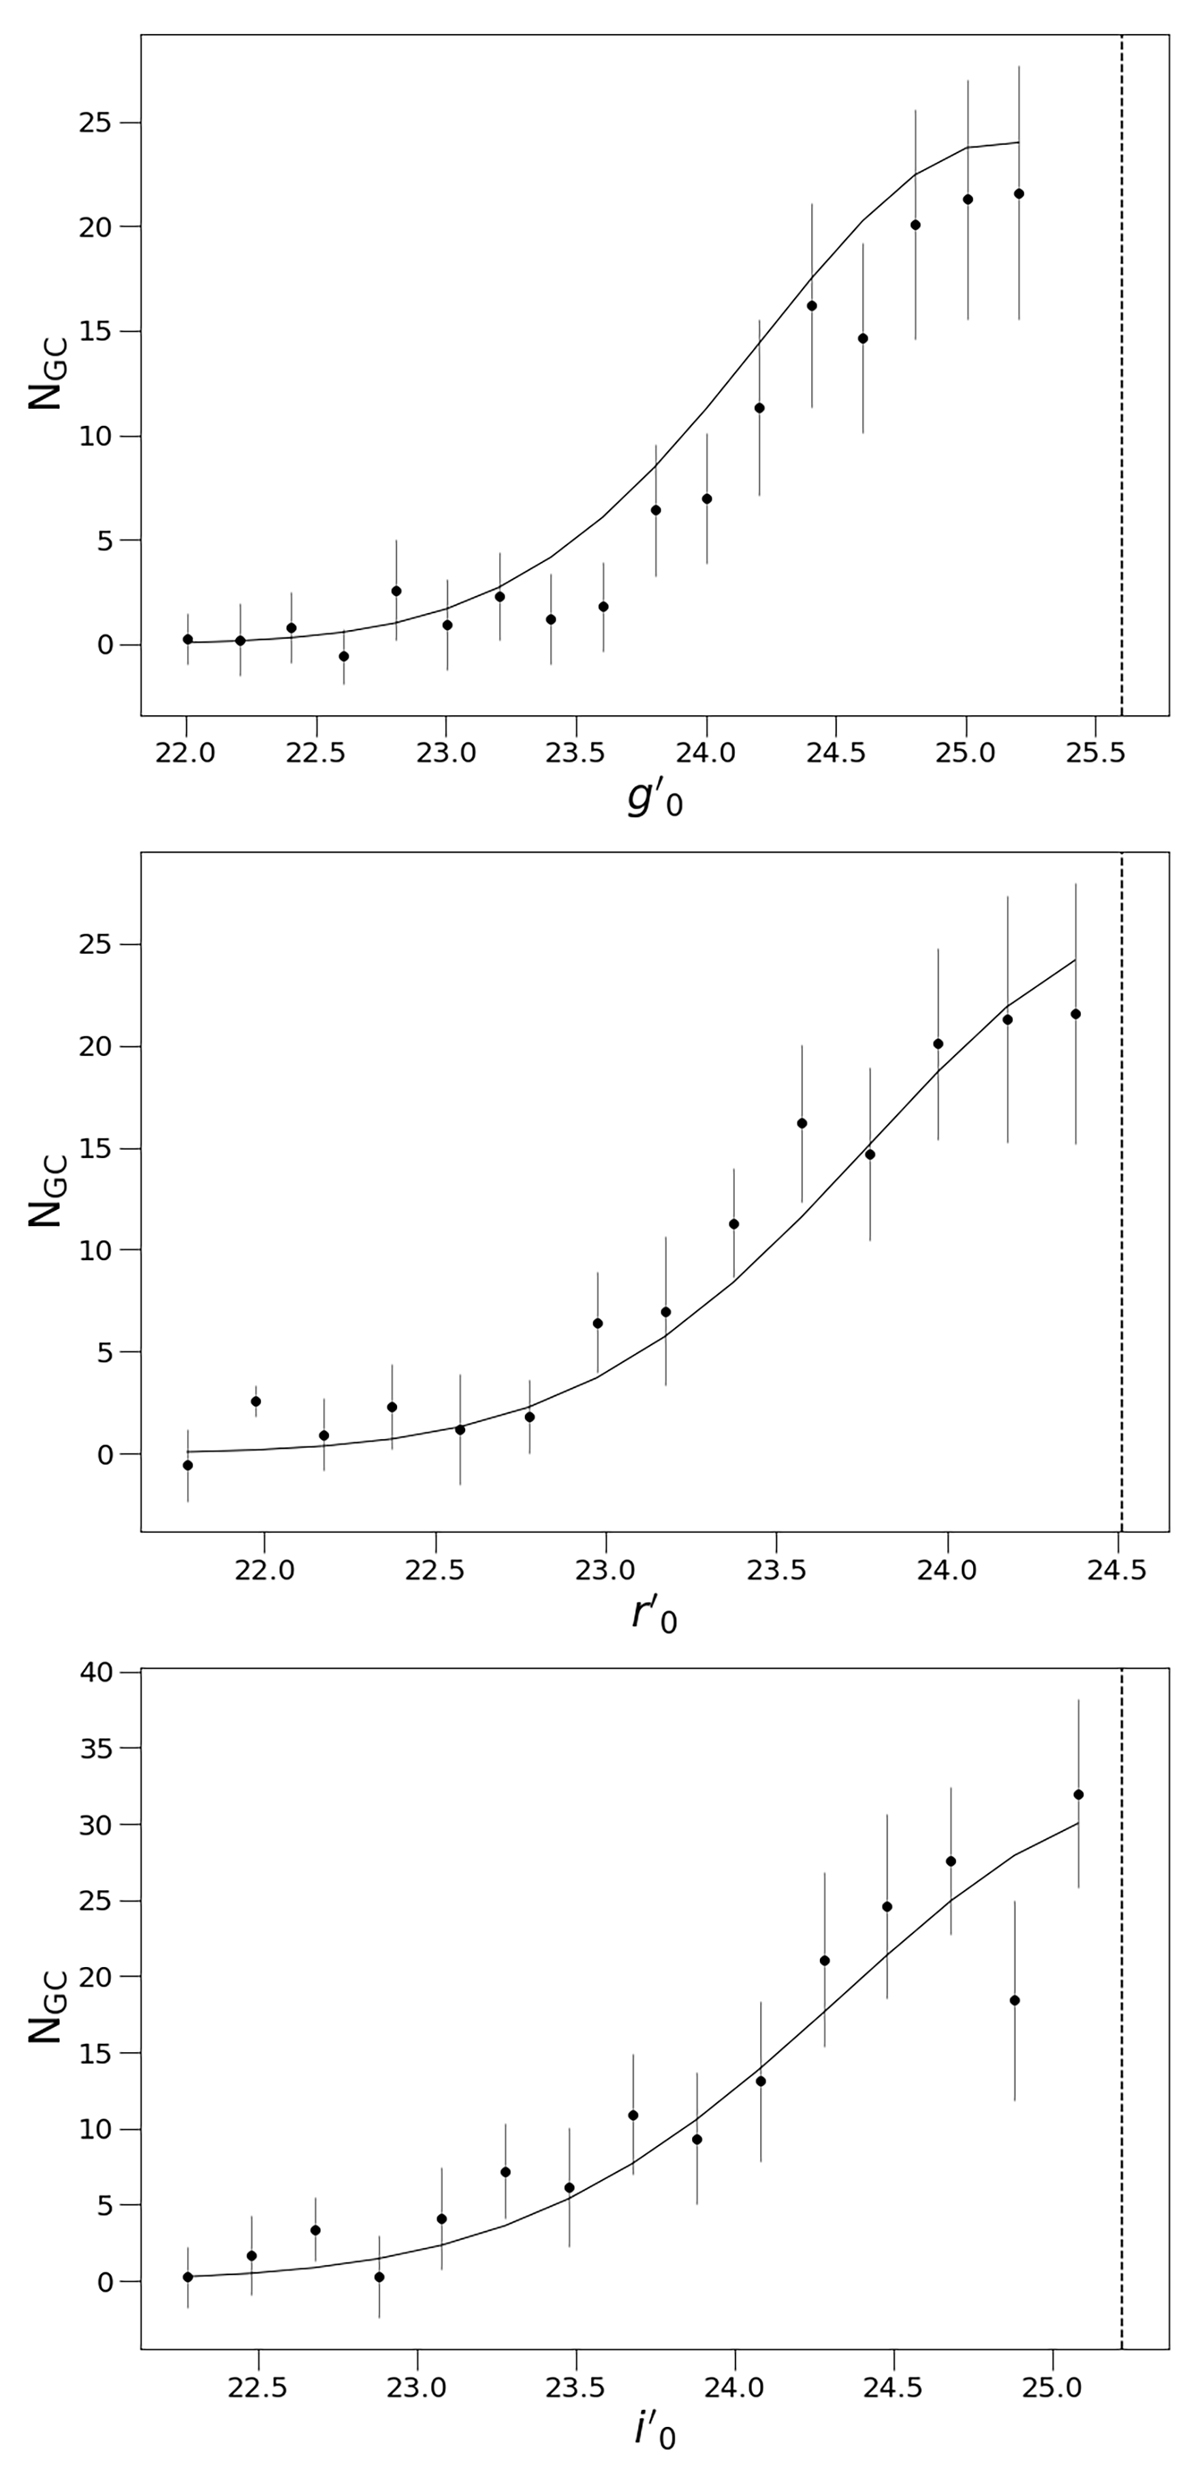
GCLF of the region between NGC 4709 and NGC 4696. Top, Middle, and Bottom panels: GCLF in the g′0, r′0, and i′0 bands, where the black dots represent the number of clusters corrected for the completeness fraction and for the background level divided in bins of 0.2 mag, and the solid line represents the best-fit Gaussian. The dashed lines show the magnitudes at which we have a 67% completeness.
Current usage metrics show cumulative count of Article Views (full-text article views including HTML views, PDF and ePub downloads, according to the available data) and Abstracts Views on Vision4Press platform.
Data correspond to usage on the plateform after 2015. The current usage metrics is available 48-96 hours after online publication and is updated daily on week days.
Initial download of the metrics may take a while.