| Issue |
A&A
Volume 701, September 2025
|
|
|---|---|---|
| Article Number | A23 | |
| Number of page(s) | 16 | |
| Section | Extragalactic astronomy | |
| DOI | https://doi.org/10.1051/0004-6361/202555312 | |
| Published online | 28 August 2025 | |
A song of interactions and mergers: The case of NGC 4709⋆
1
Instituto de Astrofisica, Depto. de Fisica y Astronomia, Facultad de Ciencias Exactas, Universidad Andrés Bello, Av. Fernandez-Concha 700, Las Condes, Santiago, Chile
2
European Southern Observatory, Alonso de Cordova 3107, Vitacura, Santiago, Chile
3
Institute of Physics, Laboratory of Astrophysics, École Polytechnique Fédérale de Lausanne (EPFL), Observatoire de Sauverny, 1290, Versoix, Switzerland
4
European Southern Observatory, Karl-Schwarzschild-Strasse 2, 85748, Garching bei München, Germany
⋆⋆ Corresponding author: This email address is being protected from spambots. You need JavaScript enabled to view it.
Received:
27
April
2025
Accepted:
13
July
2025
Abstract
Context. Globular clusters (GCs) are fundamental tools to unveil the interaction and merger history of their host galaxies.
Aims. Our goal is to perform the photometric analysis of the globular cluster system (GCS) of the elliptical galaxy NGC 4709, which is the brightest galaxy of the Cen 45 spiral-rich galaxy group, and to highlight its interaction history with NGC 4696, the giant elliptical galaxy of the Cen 30 subcluster.
Methods. We obtained deep Magellan 6.5 m/MegaCam (g′, r′, i′) photometry, with which we identified a sample of 556 GC candidates around NGC 4709 that were analyzed in the context of the interaction history with the giant elliptical NGC 4696 and other galaxies of the Cen 45 group. After modeling and subtracting the galaxy light, we used criteria based on shape, colors and magnitude to select GC candidates.
Results. Our results point toward a complex interaction history that shaped the GCS of NGC 4709. Inside a galactocentric radius r < 5 × reff, two populations were found with mean colors of (g′−i′)0 = 0.905 ± 0.009 mag and (g′−i′)0 = 1.170 ± 0.008 mag. The azimuthal distribution of the GCs show peaks at the position angles PA1 = 92° and PA2 = 293°, with PA2 coinciding with the direction toward NGC 4696, confirming that the interaction between these galaxies shaped the GCS of NGC 4709. From the GC luminosity function we derived a distance of 29.9 ± 2.1 Mpc, which is much closer than the other galaxies of the Centaurus cluster, and a specific frequency of SN = 3.7 ± 0.5, in good agreement with previously estimated values. From the GCs density maps, we identified overdensities corresponding to the positions of five other galaxies of the Centaurus cluster, and we found a bridge of GCs between NGC 4709 and NGC 4696 with a distance of d = 34.69 ± 2.21 Mpc, which is between that of the two galaxies.
Conclusions. All of these findings point toward a complex GCS for NGC 4709, strongly influenced by the interaction with NGC 4696, and confirm previous findings that the galaxy’s apparent distance is smaller than that of the main cluster galaxy NGC 4696 by ∼8.5 Mpc and that it is smaller than the distance of the other Centaurus’ galaxies, making it an outlier in Centaurus and suggesting a past first encounter with Cen 30. In future work, we will combine our data with E-MOSAICS simulations to unravel the trajectory of NGC 4709, from the past interaction to the future new rendezvous with NGC 4696.
Key words: galaxies: clusters: general / galaxies: individual: NGC 4709 / galaxies: star clusters: general
This paper includes data gathered with the 6.5 meter Magellan Telescope located at Las Campanas Observatory, Chile, and obtained with MegaCam (McLeod et al. 2006). The data products are produced by the OIR Telescope Data Center, supported by the Smithsonian Astrophysical Observatory.
© The Authors 2025
 Open Access article, published by EDP Sciences, under the terms of the Creative Commons Attribution License (https://creativecommons.org/licenses/by/4.0), which permits unrestricted use, distribution, and reproduction in any medium, provided the original work is properly cited.
This article is published in open access under the Subscribe to Open model. This email address is being protected from spambots. You need JavaScript enabled to view it. to support open access publication.
1. Introduction
Globular clusters (GCs) are important tools to study the matter distribution and interaction history of their host galaxies. They are defined as compact, gravitationally bound systems of stars, which have a typical mean mass of ∼2 × 10⁵ M⊙ (Beasley 2020). Even though some GCs in the region of the Galactic center (Minniti et al. 2021) and disk (Binney & Wong 2017) are missing due to heavy obscuration by interstellar dust, the study of the globular cluster system (GCS) of the Milky Way can be used as a template for the analysis of extragalactic GCs. In particular, the GCS of the Milky Way contains 170 GCs (Vasiliev & Baumgardt 2021; Ishchenko et al. 2023), with ∼300 recently discovered candidates (e.g., Garro et al. 2021; Dias et al. 2022), thanks to surveys such as the VISTA Variables in the Via Láctea (VVV; Minniti et al. 2010) and the VISTA Variables in the Via Láctea eXtended (VVVX; Minniti 2018). These GCs show a bimodal color distribution (e.g., Renaud et al. 2017) and metallicity distribution (e.g., Garro et al. 2024), with the metal-rich GCs being more concentrated toward the Galactic center, whereas the metal-poor GCs extend out to 145 kpc in the Galactic halo (Beasley 2020). In the Milky Way, we can resolve GCs into their single stars out to ∼20 Mpc with space-based missions such as the Hubble Space Telescope (HST), whereas with ground-based telescopes, as we go outside the Local Group, they appear as point-like sources. The first study of the GCS of M87 (Racine 1968) showed a large number of GC candidates, and more recent studies have placed it among the richest GCSs (Oldham & Auger 2016). Since then, GCSs have been studied in other galaxies, both in groups (e.g., Urbano et al. 2025; Obasi et al. 2023; Taylor et al. 2017) and clusters (e.g., Lomelí-Núñez et al. 2025; Janssens et al. 2024; Federle et al. 2024; Puzia et al. 2002). Two scenarios seem to emerge: the presence of a single or of multiple populations of GCs highlighted from the uni-, bi-, or multimodality of the color distribution. For example, in the case of NGC 4262, a color bimodality was observed, and the properties of the GCS suggest that the galaxy might be transitioning into an elliptical (Akhil et al. 2024). On the other hand, for the GCS of NGC 4365 a trimodal color distribution was identified with blue, “green”, and red GC populations (Puzia et al. 2002). The origin of the “green” GC population is still uncertain, but it could be the result of a merger with a gas-rich galaxy resulting in the formation of new GCs or it could have been stripped via gravitational interaction from the nearby S0 galaxy NGC 4342 (Blom et al. 2014). Other examples are the GCS of NGC 4382, for which, besides two old GC populations, a young one with an age of 2.2 ± 0.9 Gyr was observed (Escudero et al. 2022), and NGC 1316 in the Fornax cluster where, besides the blue and red populations, an intermediate one with an age of ∼5 Gyr and a very young population with an age of ∼1 Gyr were observed (Richtler et al. 2014; Sesto et al. 2016).
It has been shown that the relation between the number of GCs and the stellar mass of the host galaxy is nonlinear, with low-mass galaxies (especially dwarfs) and very massive galaxies being more prone to produce GCs than stars with respect to galaxies of intermediate masses (Beasley 2020). Moreover, the specific frequency of the GCSs depends on the galaxy’s morphology, with the highest values found in giant and dwarf ellipticals, whereas the lowest values belong to late-type galaxies (e.g., Harris 1991; Georgiev et al. 2010; Alamo-Martinez et al. 2013; Obasi et al. 2023). However, some exceptions arise in galaxy groups, where the loss of GCs through interactions results in early-type galaxies having a low specific frequency, such as in the case of NGC 5018 (Lonare et al. 2025). It has been shown that the GCSs can extend from the inner regions of a galaxy to the outer haloes, with a halo population particularly numerous in early-type galaxies (Reina-Campos et al. 2022), where they can reach galactocentric distances of 5 − 20 reff (Reina-Campos et al. 2023). This allows to study the kinematics and mass distribution of the host galaxies at large distances from the galactic center, where it is not possible to obtain 2D kinematic models of the stellar light, which for most galaxies is limited to 1 reff, and up to 2 − 4 reff for some early-type galaxies (e.g., Proctor et al. 2009; Dolfi et al. 2021). Galaxies in clusters are more likely to undergo multiple major and minor mergers. Despite the fact that the velocity dispersion is large, the infall of galaxy groups provides a mechanism that promotes slow encounters and mergers within the cluster (Mihos 2004). Moreover, simulations of tidal interactions in galaxy clusters highlight the tendency of massive galaxies to be strongly clustered, so the probability of galactic collisions and mergers increases (Gnedin 2003). These merger events affect not only the morphologies of the galaxies but also of their GCSs. Mergers can account for debris such as tidal tails, which are large elongations on one side of a galaxy, that are particularly evident in the Antennae galaxies (e.g., Lahén et al. 2018). Such features show the presence of dynamically linked groups of GCs that can give information on the interaction history of their host galaxies, as demonstrated in the cases of M 31 (Veljanoski et al. 2014) and NGC 5128 (Hughes et al. 2023). Tidal features were also identified photometrically, and are characterized by the presence of GCs, which can give more insights into the accretion history of the host galaxy, such as in the Dorado group (Urbano et al. 2025). Merger events can also account for different populations of GCs, as was found in the low-mass early-type galaxy NGC 4150 (Kaviraj et al. 2012). In fact, models have predicted that the red population of GCs would form in situ and would be more concentrated toward the bulge of the host galaxy, whereas the bluer GCs represent the accreted components and would reside in the halo (Côté et al. 1998). This was confirmed by MOdelling Star cluster population Assembly In Cosmological Simulations within EAGLE (E-MOSAICS; Pfeffer et al. 2018) simulations, where we can see that in situ and accreted GCs have comparable numbers in the inner parts of the halo, whereas GCs in the outskirts of the galaxies have a preferentially accreted origin (Reina-Campos et al. 2022).
The Centaurus cluster is an ideal target to study such features. It is composed of the subcluster Cen 30, which represents the main component dominated by the giant elliptical NGC 4696, and Cen 45, a spiral-rich subcomponent dominated by NGC 4709 (Lucey et al. 1986). The velocity distribution of cluster galaxies reveals the young, unrelaxed nature of the system, with Cen 45 being an infalling galaxy group (Stein et al. 1997). Interactions between galaxies were confirmed in the central region of Centaurus by the presence of a filamentary structure connecting NGC 4696 to NGC 4696B, by a metallicity excess around NGC 4709 (Walker et al. 2013), and by asymmetric temperature variations in the X-ray gas with the hottest regions coinciding with NGC 4709 (Churazov et al. 1999), which is consistent with shock-heated gas due to the past interaction between Cen 45 and Cen 30 (Veronica et al. 2025). Furthermore, NGC 4696 is characterized by a filamentary structure crossing its central regions and extending toward NGC 4696B, suggesting that it underwent some merging phenomena in the past (Churazov et al. 1999) or that the material was acquired by ram-pressure stripping of NGC 4696B (Walker et al. 2013). Interactions between galaxies in Centaurus are also reflected by the shape and properties of their GCSs. In Federle et al. (2024), we studied the GCS of NGC 4696 and determined that it presents a bimodal color distribution, with the blue and red populations divided at a color (g′−i′)0 = 0.905 mag, and indications of the presence of an intermediate age GC population in the central regions of the galaxy. Moreover, the analysis of the azimuthal distribution of the GC candidates shows peaks coinciding with the directions of NGC 4696B and NGC 4709, confirming that the interactions between these galaxies shaped the GCS of NGC 4696. Finally, from the GC luminosity function, we found a distance of d = 38.36 ± 2.49 Mpc for NGC 4696, which is consistent with the distance of 42.5 ± 3.2 Mpc from Mieske et al. (2005).
In this paper, we expand our work done in Federle et al. (2024) to Field 1 of the Centaurus cluster (Fig. 1), with particular attention given to the characterization of the GCS of NGC 4709, whose properties are reported in Table 1. The paper is organized as follows. In Sect. 2 we describe the observation and data reduction, in Sect. 3 we present the selection criteria, in Sect. 4 we present the analysis of the GC candidates, in Sect. 5 we compare the results with the profile of NGC 4709, in Sect. 6 we derive the GC luminosity function, in Sect. 7 we present the properties of the GC distribution, and in Sect. 8 we provide the conclusions.
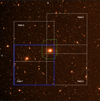 |
Fig. 1. Centaurus cluster. The image shows the four fields obtained during the observation. The field-of-view is of 1 × 1 deg2, which corresponds to 0.742 × 0.742 Mpc2, with the north pointing in the upward direction and the east in the leftward direction. The green line delimits the region of ∼8.795 × 11.494 arcmin2 we analyzed in Federle et al. (2024), whereas the blue line represents the region of 26.91 × 26.40 arcmin2 analyzed in this work (Field 1). |
Observational properties of the galaxies NGC 4709 and NGC 4696.
2. Observations and data reduction
2.1. Description of the data
We observed four fields of the Centaurus cluster (Fig. 1), with MegaCam mounted on the Magellan 6.5 meter telescope during two nights in April 2018. A detailed description of the observations – including field-of-view, data reduction pipeline, exposure times, and image stacking process – is given in Federle et al. (2024). Briefly, the observation covers 1 × 1 deg2 of the Centaurus cluster, which corresponds to 0.742 × 0.742 Mpc. The central giant elliptical galaxy NGC 4696 was located close to the corner of each of the four observed fields. The data presented here correspond to Field 1 of the Centaurus cluster, which contains the Cen 45 galaxy group, with total exposure times of 3300, 2400, and 3600 s for the g′, r′, and i′ filters, respectively. The field-of-view is of 26.91 × 26.40 arcmin2 and contains both NGC 4709 and NGC 4696 (see the blue rectangle in Fig. 1). In green in Fig. 1, we overlay the region that we analyzed in Federle et al. (2024). We note that the total exposure time is not homogeneous across the indicated field due to the combination of different exposures in order to fill the gaps between CCDs. However, exposure maps were used in our photometry to properly weight each region. The observation log is summarized in Table 2. Most of the data reduction was performed through the dedicated MMT/Magellan MegaCam pipeline (McLeod et al. 2015). Specifically, tasks such as WCS fitting, fringe, and illumination corrections were all done automatically and carefully checked at each reduction step. For this work, we used the individual fits files as processed by the pipeline, but with our own parameters for the stacked mosaic, which was done with Swarp (Bertin et al. 2002) and using Astropy (Astropy Collaboration 2013, 2018) to perform preliminary statistics on common empty sky regions. The quality and photometric homogeneity of the stacked images were carefully checked in each step. We present here the analysis of Field 1 of the Centaurus cluster, with particular focus on the elliptical galaxy NGC 4709, which is the main component of the Cen 45 group.
Observation summary.
2.2. Subtraction of the galaxy light
In order to maximize the detection and perform photometry of the GC candidates, we first calculated the models of the surface brightness distribution of NGC 4709 and other four galaxies in Field 1. In this way, the residual images show compact sources otherwise immersed in the galaxies’ light. The models of the surface brightness distribution were obtained using ISOFIT and CMODEL packages (Ciambur 2015) in IRAF1. These are implementations of the ELLIPSE and BMODEL tasks (Jedrzejewski 1987), which allow the calculation of the model of the surface brightness distribution by fitting elliptical isophotes to the galaxy via a Fourier series expansion. The surface brightness of the isophotes was calculated as:
 (1)
(1)
where ⟨Iell⟩ is the surface brightness the isophote would have if it was a perfect ellipse, ψ is the eccentric anomaly, and An and Bn are the Fourier coefficients (Ciambur 2015).
We used ISOFIT because we find it to be more accurate than ELLIPSE in the interpolation of the isophotes in this case. In fact, it samples them using the eccentric anomaly, which results in equal length arcs on the ellipse and better describes the deviations from the elliptical form of the isophotes (Ciambur 2015). In order to calculate these deviations, the program allows the user to add higher harmonics and use them as input for the CMODEL task. We used the first four harmonics, which are given by default, and describe the coordinates of the center of the galaxy, the ellipticity, and the position angle, and, in the case of NGC 4709, we added the n = 6 harmonics in all three bands. We only used the even harmonics because the odd ones introduce a negligible correction in the case of a galaxy with no significant asymmetries (Ciambur 2015), such as NGC 4709. The models were calculated after masking external galaxies and point-like sources present in the field, in order to have a precise measure of the light of the galaxy under consideration. In the case of NGC 4709, to describe the central regions, we left the coordinates of the center, the position angle (PA), and ellipticity as free parameters, whereas in the external regions, we fixed their values in order to reach the faint halo of the galaxy. The parameters used in ISOFIT for the analysis of NGC 4709 are listed in Table 3.
Properties of the models of the surface brightness distribution of NGC 4709 in the i′ band.
2.3. Source detection and photometry
After the subtraction of the models from the images, we ran the SExtractor package (version 2.19.5; Bertin & Arnouts 1996) to detect sources. After some experimentation, we chose a Gaussian filter, a detection threshold of 3 × σsky, a detection minimum area of 5 pixels, a background filter size of 3, and a background mesh of 24. Finally, the aperture photometry was performed using an annulus of 2 × FWHM and a background annulus of 5 pixels of thickness. We found 36232 sources in common in the three filters in Field 1. The photometric calibration was performed using standard stars from the NOAO Source Catalog (Nidever et al. 2020). The Galactic extinction varies across the considered field-of-view. To take this into account, we calculated the extinction coefficients for each source using the extinction maps by Schlafly & Finkbeiner (2011) 2. We found 20532 sources in common between our catalog and the NSC catalog. For the calibration, we considered only those sources for which in the NSC catalog the number of observations was > 3, and that have a stellarity index > 0.9 in order to exclude extended sources. Moreover, we visually checked the remaining objects and selected a subsample of 568 sources spread all across the field for calibration. The magnitudes reported in this work are in the AB system.
At the distance d = 42.5 ± 3.2 Mpc of Centaurus (m − M = 33.14 ± 0.17 mag; Mieske et al. 2005), GCs appear as unresolved sources. In fact, their typical effective radius of reff ∼ 3 pc corresponds to just ∼0.015 arcsec here. The analysis of the shape of the sources is then fundamental for a preliminary selection of GCs. SExtractor allows the user to estimate the type of object analyzed with the CLASS_STAR parameter, which has a value between zero and one (Bertin & Arnouts 1996). In particular, objects with CLASS_STAR = 1 are stellar (point-like) objects, while those with CLASS_STAR = 0 are extended sources. In order to separate GCs from galaxies, we divided the detected sources into two subsamples with CLASS_STAR > 0.5 and CLASS_STAR ≤ 0.5 in the i′0 filter, which corresponds to the image with the best seeing. In this way, we found 18651 compact (or unresolved) sources with CLASS_STAR > 0.5, which are shown in the color-magnitude diagram in the top panel of Fig. 2.
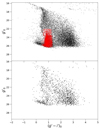 |
Fig. 2. Comparison between the color magnitude diagram of the target field and that of the background region. Top panel: Color-magnitude diagram of the 18 651 sources (black dots) selected according to their shape. The plot shows the g′0 magnitude as a function of the (g′−i′)0 color. The red dots represent the sources after the selection on colors and magnitudes. Bottom panel: Color-magnitude diagram of the background region. The plot shows the g′0 magnitude as a function of the (g′−i′)0 color for the 1639 compact sources (8.79% of the total sources in Field 1) located in the rectangle region of 11.10 × 6.95 arcmin2 (11.87% of Field 1) used to calculate the background level (see green rectangle in Fig. 3). |
3. Selection of globular cluster candidates
Figure 2 shows a very large spread in color of the selected sources. In order to eliminate potential contaminants from the 18651 compact sources, such as foreground stars and background objects, we applied a second selection criterion based on (g′−r′)0 and (r′−i′)0 colors, and on the g′0 magnitudes. In particular, we used 0.35 < (g′−r′)0 < 0.85, 0.0 < (r′−i′)0 < 0.55, and g′0 > 22.0 as described in Faifer et al. (2017). These limits were obtained in Faifer et al. (2011) for the GCSs of five early-type galaxies located at a distance modulus between 29.93 ± 0.09 and 31.90 ± 0.20. Given these distances and that of NGC 4709 (see Table 1), we could apply the same color selection since redshift effects are negligible. The color limits were obtained by Faifer et al. (2011) by considering the completeness of the GC sample and the magnitudes of Galactic GCs. In particular, the bright limit corresponds to MI > −12 mag, which represents the typical separation between GCs and ultra-compact dwarfs (UCDs). Moreover, as shown in Fig. 8 in Faifer et al. (2011), the limits cover the metallicity range expected for GCs. Our selection considers a somewhat larger range in color to take into account for the increasing errors toward fainter magnitudes. Using these limits, we obtained a sample of 5191 GC candidates, whose properties are summarized in Table A.1. From Fig. 2, we observed that there are a lot of unselected sources (black dots) in the region defined by our selection. This is caused by the fact that the selection was made only on the (g′−r′)0 and the (r′−i′)0 colors and not on the (g′−i′)0 color. Fig. 3 shows the positions of the sources with respect to the center of NGC 4709.
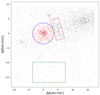 |
Fig. 3. Positions of the GC candidates with respect to the center of the galaxy. The plot shows the declination and right ascension of the sources, where the center of NGC 4709 (blue point) is located at (Δδ, Δα)=(0, 0). The blue circle defines the limit used to define the GCS of NGC 4709. The green rectangle represents the ∼77.22 arcmin2 region where the contamination level from background objects was calculated, the cyan point is the position of the center of NGC 4696, and the red rectangle is the ∼20.89 arcmin2 region between NGC 4709 and NGC 4696 for which we calculated the luminosity function in Sect. 7. The field-of-view is of 26.91 × 26.40 arcmin2. |
4. Results
4.1. Color-magnitude diagram
At this point, the sample of GC candidates defined using a selection on the stellarity index (CLASS_STAR > 0.5 in the i′0 filter), the colors (0.35 < (g′−r′)0 < 0.85 and 0.0 < (r′−i′)0 < 0.55), and magnitude (g′0 > 22), includes 5191 sources. In order to test the detection limits of our photometry, we performed the completeness test of the GC sample. In particular, we used the ADDSTAR task (Stetson 1987) in IRAF to add 5000 artificial star-like objects per each magnitude considered based on the PSF estimated with DAOPHOT (Stetson 1987). The task allows the user to add point-like sources at chosen magnitudes and positions, which in our case is important to recover their colors. The artificial stars were then added in the three filters at chosen positions in steps of 0.2 magnitudes, so that the total number of sources added with magnitudes of 17.0 ≤ g′0 ≤ 28.8 mag is 300 000. Given the large field-of-view, the addition of 5000 objects in each step allowed us to get a good number statistics, but also to avoid crowding effects. Using SExtractor with the same parameters as before, we determined how many of the added stars could be recovered in the three filters. The magnitudes were corrected using the same zeropoint as before. Moreover, we made sure that the artificial stars were added in the same positions in all three filters, and that they had a color of (g′−i′)0 = 0.878, which represents the mean for our sample. Finally, we limited our completeness test to a circular region around NGC 4709 with a galactocentric radius of r = 3.593 arcmin, which corresponds to 5 × reff. In this region, we have 244 artificial stars and 881 GC candidates. In Fig. 4, the 50% completeness limit is reached at a magnitude g′0 = 25.77 mag, so by choosing to limit our study at g′0 ≤ 25.46 mag, where we have a 67% completeness (as we did in Federle et al. 2024), we are well above the 50% completeness.
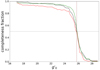 |
Fig. 4. Completeness test. The plot shows the completeness fraction as a function of the g′0 magnitude for the artificial stars added in the three filters inside a galactocentric radius of 5 × reff (black line), for the artificial stars inside the rectangular region used to estimate the background contamination (green line), and inside the region between NGC 4709 and NGC 4696 (red line) represented by the red rectangle in Fig. 3. The dashed lines show the 50% completeness limit. |
Despite the morphological and color selection criteria, some of the point-like sources are likely to be foreground or background objects, such as Milky Way stars or background galaxies, so an additional correction must be applied. For an upper limit estimate of the potential background contamination, we selected a rectangular region with an area of ∼77.22 arcmin2 located in the lower part of the image at a sufficiently large distance from NGC 4709, with the upper limit of the rectangle at a galactocentric distance of ∼13.6 × reff (see the green region in Fig. 3). We ran the photometry and completeness test on the rectangular region using the same parameters as before. The total number of sources in the background region is 3432, of which 1639 were classified as compact by SExtractor. The number of sources after the shape, colors, and magnitude selection is 169. The color-magnitude diagram of the sources in the background region is shown in the bottom panel of Fig. 2. Of the sources added with the ADDSTAR task, 448 fall inside the rectangular region. The results of the completeness test for the background region are shown by the green line in Fig. 4. In order to correct the number of GC candidates for the background level, we corrected the background counts for the completeness fraction in the rectangular region and rescaled them to take into account the difference between the area under consideration and that in which the background was estimated. After the correction, we have a total number of 88 background sources. We divided both the sources in the background region and the GC candidates in bins of 0.3 mag according to their (g′−i′)0 color, calculated the number of sources and background in each bin, and used the function random.sample() in Python to randomly discard the same number of background sources in each bin from our GC sample. The final number of GC candidates of NGC 4709 located inside a galactocentric radius of 3.593 arcmin (5 × reff; blue circle in Fig. 3) reduces to 556.
Finally, to estimate which fraction of sources corresponds to foreground stars in the Milky Way, we compared our results with the star counts given by the Besançon model of the Galaxy3 (Robin et al. 2003). We ran the simulation for the MegaCam filters, considering a region with the same area as our background region and with 18.0 ≤ g′0 ≤ 28.0 mag. With these values, we found 17 sources, of which only two are within the range of the color-magnitude cut applied to select our GC candidates. From this result, we concluded that the contribution of foreground stars to the background level is negligible.
4.2. Color distribution
The color distribution of the 556 GC candidates, selected according to the selection criteria in Sect. 3 and corrected for the background level, is more complex than a single Gaussian. Bimodality has been found in most GCSs of elliptical galaxies and has been confirmed in NGC 4696, the central giant elliptical of the Centaurus cluster (Federle et al. 2024). To investigate this issue in NGC 4709 we analyzed the color distribution of the GC candidates using the Gaussian Mixture Modeling (GMM) of sklearn in Python (Pedregosa et al. 2011), which allows to fit multiple Gaussians to check for multimodality. From this, we found that a bimodal Gaussian, with the blue peak at (g′−i′)0 = 0.905 ± 0.009 mag and the red peak at (g′−i′)0 = 1.170 ± 0.008 mag, is preferred over a unimodal or a trimodal one (see Fig. 5). The red and blue populations were divided at the color for which the GMM fit gave an equal probability for the object of belonging to the red or blue subsamples (as described in Escudero et al. 2018). In our case, the color cut of the total sample corresponds to (g′−i′)0 = 1.044 mag, which is redder than what we found for the GCS of NGC 4696 (Federle et al. 2024). To test whether two Gaussians are preferable instead of three or more, we used the Bayesian Information Criterion (BIC; Schwarz 1978) implemented in astroML (VanderPlas et al. 2012), which, given the data and a certain number of components for the model, estimates the quality of the model. We performed the BIC test using a number of components from one to six. As can be seen from Fig. 5, the best-fit, for which the value of the BIC is minimum, is obtained for a model with two Gaussians.
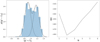 |
Fig. 5. Bayesian Information Criterion test on the GCS of NGC 4709. Left panel: Probability density function versus (g′−i′)0 color. The black line represents the best-fit model, the dashed lines represent the two Gaussians described by the model. The color distribution is divided in bins according to the Freedman-Diaconis rule (Freedman & Diaconis 1981). Right panel: Values of the BIC as a function of the number of components in the model. |
5. The shape of the globular cluster system and comparison with NGC 4709 profile
We studied the angular distribution of the GC candidates around NGC 4709, since this is an additional test to probe its interaction history. In particular, the comparison with the position of NGC 4696 is important since Walker et al. (2013) outlined that the X-ray emission shows signs of interactions between these galaxies, and in Federle et al. (2024) we showed that the GCS of NGC 4696 has clear peaks in the directions of NGC 4709 and NGC 4696B.
The azimuthal distribution is described by an asymmetric sinusoidal, with peaks at position angles of PA and PA
 . PA2 coincides within the errors with the direction of NGC 4696, confirming that the interaction between the two galaxies shaped not only the GCS of NGC 4696 as we found in Federle et al. (2024), but also the GCS of NGC 4709.
The sinusoidal shape of the GCS is frequently found among elliptical galaxies. In order to calculate the parameters of the distribution of the GCS, we performed the 2D Kernel Density Estimation of sklearn.neighbors (Pedregosa et al. 2011) to create a grid of the sample locations using the physical positions of the GC candidates in the image, and we used the results to fit a Bivariate Gaussian Distribution using a routine in astroML (VanderPlas et al. 2012). The outputs of this routine are the position of the center of the ellipse, the sigmas of the two Gaussians, which can be used as major and minor axes to calculate the ellipticity and the position angle. The results within a 68% confidence interval are shown in Table 4.
Shape of the GCS.
NGC 4709 is an elliptical galaxy of type E1 (de Vaucouleurs et al. 1991). We ran ISOFIT using the Fourier coefficients a3, a4, a6, b3, b4, and b6, to quantify the deviations from the elliptical shape of the isophotes (Ciambur 2015). Our model is limited to a galactocentric radius of 1.864 arcmin, where the sky level is reached. From our results, we found an effective radius of 0.719 arcmin and an ellipticity of e = 0.121 ± 0.02, which is lower than the values of  ,
,  , and
, and  found for the total, red and blue GC populations. We found a position angle of PA = 103.78 ± 0.57 for NGC 4709, which is different than what was found for the GCS. In particular, the GCs distribution shows peaks at the position angles of PA =
  deg and PA =
  deg. This means that the GC distribution is not aligned with the radial profile of the host galaxy, which points toward a disturbed GCS, with a shape that was influenced by past interactions with NGC 4696. Our results, together with what we found for NGC 4696 in Federle et al. (2024), agree with the interaction scenario highlighted by X-ray studies that found a metallicity excess around NGC 4709 (Walker et al. 2013) and by asymmetric temperature variations in the X-ray gas with the hottest regions coinciding with NGC 4709 (Churazov et al. 1999).
6. Globular cluster luminosity function and specific frequency
The globular cluster luminosity function (GCLF) is an important tool to determine the richness of a GCS. Furthermore, its turnover magnitude is used as a distance estimator for its host galaxy (e.g., Rejkuba 2012). It is defined as:
![Mathematical equation: $$ \begin{aligned} \frac{\mathrm{d}N}{\mathrm{d}M}\propto \frac{1}{\sigma \sqrt{2\pi }}\exp \left[-\frac{(m-M)^2}{2\sigma ^2}\right] \end{aligned} $$](/articles/aa/full_html/2025/09/aa55312-25/aa55312-25-eq29.gif) (2)
(2)
where dN is the number of GCs in the magnitude bin dm, m and M are the apparent and absolute turnover magnitudes, and σ is the width of the Gaussian distribution.
In this section, we estimate the distance to NGC 4709 from the GCLF and, based on that distance, we determine the specific frequency, SN, of the GCS. SN is related to the total number of GCs and to the luminosity of the host galaxy in the V band in units of MV = −15, and it is given by (Harris & van den Bergh 1981):
 (3)
(3)
where NGC is the total number of GCs and MV is the absolute magnitude of the host galaxy. It has been shown that the specific frequency depends on the galaxy type and luminosity, with the highest specific frequencies occurring in low-mass dwarf galaxies and in giant ellipticals in galaxy clusters, where it reaches values of ∼10 for MV < −20 mag (Peng et al. 2008; Georgiev et al. 2010). We assumed the absolute turnover magnitude in the three bands to be Mg′ = −7.20 mag, Mr′ = −7.56 mag, and Mi′ = −7.82 mag (Jordán et al. 2007).
As explained in Sect. 4.1, we did not apply any statistical correction for foreground stars since the Besançon Model of the Galaxy (Robin et al. 2003) shows that the contribution of foreground stars in this region is negligible. We calculated the contamination from foreground and background sources from a ∼77.22 arcmin2 rectangular region located in the lower part of the image (see Fig. 3), with the upper side at a galactocentric distance of ∼13.6 × reff. After the shape, color, and magnitude selection, the number of sources in this region is 169. We divided our sample in magnitude bins of 0.2 mag and corrected the number of GCs in the three bands, such as:
 (4)
(4)
where N is the number of GC candidates after our selection (see Sect. 3), f is the completeness fraction, Nbkg is the number of background sources, fbkg is the completeness fraction in the background region, and Afac is a factor that takes into account the difference between the area of the GCS and the background area.
The results of the Gaussian fit in the g′, r′, and i′ bands are shown in Fig. 6, whereas the magnitudes up to which the fit was performed, the best-fit parameters, and the calculated distances are reported in Table 5. The derived distances in the three bands agree with each other within their error bars. The error weighted mean distance between the three bands is 29.9 ± 2.1 Mpc, which is consistent with both the distance of 31.6 ± 2.2 Mpc obtained with the surface brightness fluctuation method and that of 29.1 ± 4.4 Mpc obtained through the study of the GCLF by Mieske et al. (2005) and by Mieske & Hilker (2003). In Federle et al. (2024) we calculated the distance of the central giant elliptical NGC 4696, which resulted of 38.36 ± 2.49 Mpc. This value is again in good agreement with the distance obtained by Mieske et al. (2005) using both the surface brightness fluctuation method and the GCLF. With our data, we therefore derived a relative distance of 8.46 ± 3.26 Mpc between NGC 4709 and NGC 4696, which is similar to what was found by Mieske et al. (2005) and places NGC 4709 in front of the main Centaurus cluster. However, we note that the error bars of both the distances of NGC 4709 and NGC 4696 are quite large, so the distance between the two galaxies could be much lower than what we estimate in this work. Despite the differences in the radial velocities of the two components of Centaurus (Lucey et al. 1986), X-ray analysis of the intracluster medium showed that Cen 45 and Cen 30 are located at the same redshift of z ∼ 0.0104 (Ota & Yoshida 2016), which would be consistent with the distance between NGC 4709 and NGC 4696 being in the lower range given by the error bar. Nevertheless, most of the main galaxies have distances > 42 Mpc (see Table 5 in Mieske et al. 2005), which makes NGC 4709 an outlier in the Centaurus cluster.
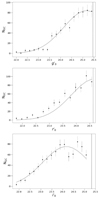 |
Fig. 6. Globular cluster luminosity function. Top, middle, and bottom panels: GCLF in the g′0, r′0, and i′0 bands, where the black points represent the number of clusters corrected for the completeness fraction and for the background level divided in bins of 0.2 mag, and the solid line represents the best-fit Gaussian. The dashed lines show the magnitudes at which we have 67% completeness. |
Best-fit parameters for the GCLF of NGC 4709.
Besides the distance, the GCLF can be used to estimate the total number of GCs in the system, which is important to determine the richness of the GCS. The total number of clusters is given by
 (5)
(5)
where A and σ are the amplitude and standard deviation of the GCLF, and the bin size = 0.2 mag. The total number of sources was obtained by integrating the GCLF, resulting in NGC, g′ = 1105, NGC, r′ = 1331, and NGC, i′ = 1142, respectively. We adopted the mean of those three numbers NGC = 1193. As the apparent magnitude for NGC 4709, we assumed the value of mV = 11.1, found by Misgeld et al. (2009). Assuming a distance modulus of (m − M)=32.38 ± 0.15 (29.9 Mpc as determined previously), we found MV, NGC 4709 = −21.28 mag. With these values, we obtained a specific frequency of 3.7 ± 0.5. This agrees within the error bars with the value of 5.0 ± 1.3 found by Mieske et al. (2005), and with typical values obtained for other elliptical galaxies.
7. Properties of the globular cluster distribution
The spatial distribution of the GC candidates in the ∼26.91 × 26.40 arcmin2 region of Field 1 is shown by the density maps in Fig. 7. The total number of candidates was corrected for the background value, so the final number of GC candidates is NGC = 2666. As shown in Fig. D.1, the total color distribution in Field 1 is bimodal, with blue and red peaks at a color of (g′−i′)0 = 0.856 ± 0.009 mag and (g′−i′)0 = 1.111 ± 0.010 mag, respectively. The separation between the two populations is at a color of (g′−i′)0 = 1.000 mag. Using this value, we found Nred = 965 and Nblue = 1701 for the red and blue populations, respectively. As can be seen from Fig. 7, the blue GC population is more evenly distributed throughout Field 1 with respect to the red one, which outside of the main galaxies shows regions with fewer GCs. This is in good agreement with the accreted origin scenario for the blue GC candidates (Brodie & Strader 2006) and with results found for other GCSs (e.g. Urbano et al. 2025). Besides the regions of NGC 4709 and NGC 4696, we found overdensities of blue GC candidates that coincide with the positions of NGC 4706, WISEA J124956.33−411536.8, and ESO 323-G 009, which were confirmed to be part of the Centaurus cluster (e.g. Chiboucas & Mateo 2007). We also note that the blue GCs seem to dominate in the region between NGC 4709 and NGC 4696. To further investigate these findings, we studied the color distribution of the GC candidates in these four galaxies and in the ∼20.89 arcmin2 rectangular region between NGC 4709 and NGC 4696 (see Fig. 3). We limited our analysis to 22.0 < g′0 < 25.46 mag and to galactocentric distances of 5 × reff, as was done for NGC 4709. In the case of NGC 4696, we used the value for the effective radius reported in the literature (reff = 1.7 arcmin) since the value we obtained from our analysis is lower due to the fact that the galaxy is located at the edge of the image so our model does not reach its outer halo. The number of sources, peaks of the color distributions, and color separations between the blue and red populations are reported in Table D.1. The GC candidates of NGC 4696 and ESO 323-G 009 show a bimodal color distribution, whereas those of NGC 4706 have an unimodal distribution. The GCS of WISEA J124956.33−411536.8 has a very low number of GCs, so it is not possible to calculate a reliable color distribution. The parameters of the four galaxies and of their GCSs are reported in Tables B.1 and B.2.
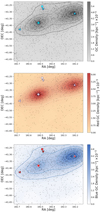 |
Fig. 7. Globular cluster candidates density maps of the full Field 1. The plots show the density maps for the total (top panel), red (middle panel), and blue (bottom panel) GC populations, and the positions of NGC 4709 (diamond), NGC 4696 (triangle), NGC 4706 (inverted triangle), WISEA J124956.33−411536.8 (circle), and ESO 323-G 009 (leftward triangle). The field-of-view is of 26.91 × 26.40 arcmin2. |
In Federle et al. (2024) we determined that the interactions between NGC 4696 and NGC 4709 shaped the GCS of NGC 4696. As seen in Sect. 6, the two galaxies belong to different components of the Centaurus cluster (Cen 30 and Cen 45, respectively) and are located at different distances, with NGC 4709 being ∼8.5 Mpc closer to us than NGC 4696. In order to see if the differences in distances could be reflected by the GC candidates’ properties, we analyzed the sources located in a ∼20.89 arcmin2 rectangular region between NGC 4709 and NGC 4696 (red rectangle in Fig. 3). In particular, the long sides of the region are located at a distance of 5 × reff from the two galaxies, which corresponds to 3.593 arcmin and 8.5 arcmin for NGC 4709 and NGC 4696, respectively. Using the same selection criteria as in Sect. 3, we found 202 GC candidates in this region. A comparison between the color-magnitude diagram of these sources and the GC candidates around NGC 4709 is shown in Fig. C.1.
The results of the completeness test in this region are shown by the red curve in Fig. 4. After correcting the counts for the background level, the number of sources in this region decreased to 109. We analyzed the color distribution using the GMM of sklearn in Python (Pedregosa et al. 2011), and we used the Akaike Information Criterion (AIC; Akaike 1974) implemented in astroML (VanderPlas et al. 2012) to test whether the distribution is uni- or multimodal. In this case, we preferred the AIC to the BIC due to the small sample size. We performed the AIC for a number of components from one to six. As can be seen from Fig. D.2 the best-fit, for which the value of the AIC is minimum, is obtained for a model with two Gaussians, with peaks at (g′−i′)0 = 0.873 ± 0.010 mag and (g′−i′)0 = 1.177 ± 0.007 mag, and a separation between the blue and red GC populations at (g′−i′)0 = 1.082 mag. The color distributions for the GCSs of NGC 4709, NGC 4696, and the region between them are compared in Fig. D.3.
From these results, we can see that the red peak of the color distribution coincides within the error bars with that of the color distribution of the GCS of NGC 4709. This suggests that the properties of the GCs in the region are similar to those of NGC 4709. We then calculated the GCLF in this region assuming the same σ derived for NGC 4709 (see Table 5). The results of the Gaussian fits in the three bands are shown in Fig. E.1, and the best-fit parameters are reported in Table E.1. We found an error weighted mean distance between the three bands of dreg = 34.69 ± 2.21 Mpc, a total number of GC candidates of NGC = 382, and a distance modulus of (m − M)=32.70 ± 0.14. The distance is between that of NGC 4709 derived in this work and that for NGC 4696 derived in Federle et al. (2024), suggesting the presence of a bridge of GCs connecting the two galaxies and that, despite the large difference in distance, NGC 4709 may have passed by NGC 4696 in the distant past. This is in good agreement with recent X-ray studies, which confirmed temperature excess in the region of Cen 45 and found the presence of shock-heated gas given by the interaction between Cen 45 and Cen 30 (Veronica et al. 2025). A comparison between the positions of GC candidates and X-ray contours is shown in Fig. F.1.
8. Conclusions
We have presented the analysis of the GCS of the elliptical galaxy NGC 4709. The measurements are based on deep Magellan 6.5m/MegaCam (g′, r′, i′) photometry. We obtained the following results:
-
Applying a two color selection and limiting our study within a galactocentric radius r < 5 × reff, we identified a total of 556 GC candidates. The GC system has a bimodal color distribution, with peaks at (g′−i′)0 = 0.905 ± 0.009 mag and (g′−i′)0 = 1.170 ± 0.008 mag, with the blue and red populations divided at (g′−i′)0 = 1.044 mag.
-
The azimuthal distribution of the GC candidates shows peaks at the position angles PA1 ∼ 92° and PA2 ∼ 293°. The position angle PA2 coincides within the errors with the direction of NGC 4696, confirming that the interaction between these galaxies shaped not only the GCS of NGC 4696, as we found in Federle et al. (2024), but also the GCS of NGC 4709. Moreover, these results are in agreement with the merger/interaction history outlined by previous X-ray works, such as a metallicity excess around NGC 4709 by Walker et al. (2013), and an asymmetric temperature variation in the X-ray gas with the hottest region coinciding with NGC 4709 by Churazov et al. (1999).
-
After correcting the number of GCs for the completeness fraction and the background sources, we calculated the GCLF in the three filters and used it for our own estimation of the distance of NGC 4709, as well as the specific frequency. As can be seen from Table 5, the distances estimated in the three filters are consistent within the errors. Moreover, our distance of d = 29.9 ± 2.1 Mpc and distance modulus of (m − M)=32.38 ± 0.15 mag are consistent with the measurement of the distance of the Centaurus cluster obtained with both the GCLF and the surface brightness fluctuation method by Mieske et al. (2005). Our results show that, despite a small angular separation of ∼14.6 arcmin (∼181 kpc at the distance of Centaurus), NGC 4709 is located in front of NGC 4696 and the other galaxies of the cluster. Moreover, the calculated distance places NGC 4709 outside of Centaurus R500, defined as the radius inside which the density of the cluster is 500 times the critical density of the Universe (e.g., Evrard et al. 1996). Given that Centaurus has a radius of R500 = 0.826 Mpc (Piffaretti et al. 2011), the distance between NGC 4709 and NGC 4696 results of ∼10.2 R500. However, given the large error bars on the distances of NGC 4696 and NGC 4709, we note that the distance between the two galaxies could be lower than what we calculated in this work, which would be consistent with the redshifts for Cen 30 and Cen 45 estimated by previous X-ray studies (Ota & Yoshida 2016). Finally, we used the peak of the GCLF to estimate the total number of GCs in NGC 4709, assuming that the luminosity function is described by a symmetric Gaussian. We then used the number of clusters to estimate the specific frequency of the system, which resulted of SN = 3.7 ± 0.5. This value is well within the range for normal ellipticals and in good agreement with previous calculations (Mieske et al. 2005).
-
The GCs color distribution of the entire Field 1 (the blue rectangular region of ∼26.91 × 26.40 arcmin2 in Fig. 1) is bimodal, with blue and red peaks at colors (g′−i′)0 = 0.856 ± 0.009 mag and (g′−i′)0 = 1.111 ± 0.010 mag, and a color separation at (g′−i′)0 = 1.000 mag.
-
The GCs density maps show overdensities of GCs corresponding to the positions of the galaxies NGC 4709, NGC 4696, NGC 4706, WISEA J124956.33−411536.8, and ESO 323-G 009. In particular, the red GC population of NGC 4709 appears more centrally concentrated with respect to the blue one, suggesting an in situ origin with fewer accreted GCs. On the other hand, NGC 4696 shows a larger blue GC population, suggesting a more turbulent past, characterized by multiple mergers and accretion events. Over the entire Field 1, the blue GC population looks more uniformly distributed with respect to the red one.
-
We analyzed the color distributions for the GCSs of the galaxies corresponding to the overdensities identified in the density maps. We found that the GCSs of NGC 4696 and ESO 323-G 009 show a bimodal color distribution, whereas NGC 4706 has a unimodal color distribution. The number of GC candidates in WISEA J124956.33−411536.8 is too low to obtain a reliable color distribution.
-
The color distribution of GC candidates located in a rectangular region between NGC 4709 and NGC 4696 is bimodal, with peaks at (g′−i′)0 = 0.873 ± 0.010 mag and (g′−i′)0 = 1.177 ± 0.007 mag, with a separation between the blue and red populations at (g′−i′)0 = 1.082 mag. It is worth noticing that the red peak of the color distribution in this region coincides within the errors with that of the GCS of NGC 4709, suggesting that their GCs have similar properties. We then calculated the GCLF in this region using the same σ as for the GCLF of NGC 4709, and we used it to estimate the distance of the GC candidates, which resulted of d ∼ 34.69 ± 2.21 Mpc. This value is between the distance of NGC 4709 estimated in this work and that of NGC 4696 that we obtained in Federle et al. (2024), suggesting the presence of a bridge of GCs connecting the two galaxies.
As a final remark, given our findings and those in literature X-ray studies (Churazov et al. 1999; Walker et al. 2013; Veronica et al. 2025), we propose that NGC 4709 interacted with NGC 4696 in the past in a high-speed flyby, in which the two galaxies had a fast close encounter. During the encounter, NGC 4709 retained its original gas but was stripped of some GCs that formed a bridge between the two galaxies. NGC 4709 was afterward captured by the Cen 45 group, and it is now going back toward Cen 30. In a future work, we will compare our results with E-MOSAICS simulations to confirm this scenario.
Data availability
The full catalog of GC candidates (Table A.1) is available at the CDS via https://cdsarc.cds.unistra.fr/viz-bin/cat/J/A+A/701/A23
IRAF is distributed by the National Optical Astronomy Observatory (NOAO), directed by the Association of University for Research in Astronomy (AURA) together with the National Science Foundation (NSF). It is available at https://iraf.noirlab.edu/
Available at https://irsa.ipac.caltech.edu/applications/DUST/
Available at http://model.obs-besancon.fr
Available at https://aladin.u-strasbg.fr/aladin.gml
Acknowledgments
S. F. and M. G. gratefully acknowledge support by ANID through Fondecyt Regular 1240755. This research has made use of the NASA/IPAC Extragalactic Database (NED), which is funded by the National Aeronautics and Space Administration and operated by the California Institute of Technology.
References
- Akaike, H. 1974, IEEE Trans. Autom. Control, 19, 716 [Google Scholar]
- Akhil, K. R., Kartha, S. S., & Mathew, B. 2024, MNRAS, 530, 2907 [Google Scholar]
- Alamo-Martinez, K. A., Blakeslee, J. P., Côté, P., et al. 2013, ApJ, 775, 20 [CrossRef] [Google Scholar]
- Astropy Collaboration (Robitaille, T. P., et al.) 2013, A&A, 558, A33 [NASA ADS] [CrossRef] [EDP Sciences] [Google Scholar]
- Astropy Collaboration (Price-Whelan, A. M., et al.) 2018, AJ, 156, 123 [Google Scholar]
- Beasley, M. A. 2020, Globular Cluster Systems and Galaxy Formation (Cham: Springer) [Google Scholar]
- Bertin, E., & Arnouts, S. 1996, A&AS, 117, 393 [NASA ADS] [CrossRef] [EDP Sciences] [Google Scholar]
- Bertin, E., Mellier, Y., Radovich, M., et al. 2002, ASP Conf. Ser., 281, 228 [Google Scholar]
- Binney, J., & Wong, L. K. 2017, MNRAS, 467, 2446 [NASA ADS] [Google Scholar]
- Blom, C., Forbes, D. A., Foster, C., et al. 2014, MNRAS, 439, 2420 [Google Scholar]
- Boch, T., & Fernique, P. 2014, ASP Conf. Ser., 485, 277 [Google Scholar]
- Bonnarel, F., Fernique, P., Bienaymé, O., et al. 2000, A&AS, 143, 33 [NASA ADS] [CrossRef] [EDP Sciences] [Google Scholar]
- Brodie, J. P., & Strader, J. 2006, ARA&A, 44, 193 [Google Scholar]
- Chiboucas, K., & Mateo, M. 2007, ApJS, 170, 95 [Google Scholar]
- Churazov, E., Gilfanov, M., Forman, W., et al. 1999, ApJ, 520, 105 [CrossRef] [Google Scholar]
- Ciambur, B. C. 2015, ApJ, 810, 120 [NASA ADS] [CrossRef] [Google Scholar]
- Côté, P., Marzke, R. O., & West, M. J. 1998, ApJ, 501, 554 [Google Scholar]
- de Vaucouleurs, G., de Vaucouleurs, A., Corwin, H. G., et al. 1991, Third Reference Catalogue of Bright Galaxies (New York: Springer) [Google Scholar]
- Dias, B., Palma, T., Minniti, D., et al. 2022, A&A, 657, A67 [NASA ADS] [CrossRef] [EDP Sciences] [Google Scholar]
- Dolfi, A., Forbes, D. A., Couch, W. J., et al. 2021, MNRAS, 504, 4923 [NASA ADS] [CrossRef] [Google Scholar]
- Escudero, C. G., Faifer, F. R., Smith Castelli, A. V., et al. 2018, MNRAS, 474, 4302 [NASA ADS] [CrossRef] [Google Scholar]
- Escudero, C. G., Cortesi, A., Faifer, F. R., et al. 2022, MNRAS, 511, 393 [NASA ADS] [CrossRef] [Google Scholar]
- Evrard, A. E., Metzler, C. A., & Navarro, J. F. 1996, ApJ, 469, 494 [Google Scholar]
- Faifer, F. R., Forte, J. C., Norris, M. A., et al. 2011, MNRAS, 416, 155 [NASA ADS] [Google Scholar]
- Faifer, F. R., Escudero, C. G., Scalia, M. C., et al. 2017, A&A, 599, L8 [NASA ADS] [CrossRef] [EDP Sciences] [Google Scholar]
- Federle, S., Gómez, M., Mieske, S., et al. 2024, A&A, 689, A342 [NASA ADS] [CrossRef] [EDP Sciences] [Google Scholar]
- Freedman, D., & Diaconis, P. 1981, Probab. Theory Relat. Fields, 57, 453 [Google Scholar]
- Garro, E. R., Minniti, D., Gómez, M., et al. 2021, A&A, 649, A86 [NASA ADS] [CrossRef] [EDP Sciences] [Google Scholar]
- Garro, E. R., Minniti, D., & Fernández-Trincado, J. G. 2024, A&A, 687, A214 [NASA ADS] [CrossRef] [EDP Sciences] [Google Scholar]
- Georgiev, I. Y., Puzia, T. H., Goudfrooij, P., et al. 2010, MNRAS, 406, 1967 [Google Scholar]
- Gnedin, O. Y. 2003, ApJ, 582, 141 [Google Scholar]
- Harris, W. E. 1991, ARA&A, 29, 543 [Google Scholar]
- Harris, W. E., & van den Bergh, S. 1981, AJ, 86, 1627 [NASA ADS] [CrossRef] [Google Scholar]
- Hughes, A. K., Sand, D. J., Seth, A., et al. 2023, ApJ, 947, 34 [NASA ADS] [CrossRef] [Google Scholar]
- Ishchenko, M., Sobolenko, M., Berczik, P., et al. 2023, A&A, 673, A152 [NASA ADS] [CrossRef] [EDP Sciences] [Google Scholar]
- Janssens, S. R., Forbes, D. A., Romanowsky, A. J., et al. 2024, MNRAS, 534, 783 [NASA ADS] [CrossRef] [Google Scholar]
- Jedrzejewski, R. I. 1987, MNRAS, 226, 747 [Google Scholar]
- Jordán, A., McLaughlin, D. E., Côté, P., et al. 2007, ApJS, 171, 101 [CrossRef] [Google Scholar]
- Kaviraj, S., Crockett, R. M., Whitmore, B. C., et al. 2012, MNRAS, 422, L96 [CrossRef] [Google Scholar]
- Lahén, N., Johansson, P. H., Rantala, A., et al. 2018, MNRAS, 475, 3934 [Google Scholar]
- Lauberts, A., & Valentijn, E. A. 1989, The Surface Photometry Catalogue of the ESO-Uppsala Galaxies (Garching: European Southern Observatory) [Google Scholar]
- Lomelí-Núñez, L., Cortesi, A., Smith Castelli, A. V., et al. 2025, AJ, 169, 263 [Google Scholar]
- Lonare, P., Cantiello, M., Mirabile, M., et al. 2025, A&A, 694, A231 [NASA ADS] [CrossRef] [EDP Sciences] [Google Scholar]
- Lucey, J. R., Currie, M. J., & Dickens, R. J. 1986, MNRAS, 221, 453 [NASA ADS] [CrossRef] [Google Scholar]
- McLeod, B., Geary, J., Ordway, M., et al. 2006, Astrophys. Space Sci. Lib., 336, 337 [NASA ADS] [Google Scholar]
- McLeod, B., Geary, J., & Conroy, M. 2015, PASP, 127, 366 [NASA ADS] [CrossRef] [Google Scholar]
- Mieske, S., & Hilker, M. 2003, A&A, 410, 445 [NASA ADS] [CrossRef] [EDP Sciences] [Google Scholar]
- Mieske, S., Hilker, M., & Infante, L. 2005, A&A, 438, 103 [NASA ADS] [CrossRef] [EDP Sciences] [Google Scholar]
- Mihos, J. C. 2004, IAU Symp., 217, 390 [Google Scholar]
- Minniti, D. 2018, Astrophys. Space Sci. Proc., 51, 63 [NASA ADS] [CrossRef] [Google Scholar]
- Minniti, D., Lucas, P. W., Emerson, J. P., et al. 2010, New Astron., 15, 433 [Google Scholar]
- Minniti, D., Palma, T., & Clariá, J. J. 2021, BAAA, 62, 107 [NASA ADS] [Google Scholar]
- Misgeld, I., Hilker, M., & Mieske, S. 2009, A&A, 496, 683 [NASA ADS] [CrossRef] [EDP Sciences] [Google Scholar]
- Nidever, D. L., Dey, A., Fasbender, K., et al. 2020, ApJ, 161, 192 [Google Scholar]
- Obasi, C., Gómez, M., Minniti, D., et al. 2023, A&A, 670, A18 [NASA ADS] [CrossRef] [EDP Sciences] [Google Scholar]
- Oldham, L. J., & Auger, M. W. 2016, MNRAS, 455, 820 [NASA ADS] [CrossRef] [Google Scholar]
- Ota, N., & Yoshida, H. 2016, PASJ, 68, S19 [NASA ADS] [CrossRef] [Google Scholar]
- Pedregosa, F., Varoquaux, G., Gramfort, A., et al. 2011, JMLR, 12, 2825 [Google Scholar]
- Peng, E. W., Jordán, A., Côté, P., et al. 2008, ApJ, 681, 197 [NASA ADS] [CrossRef] [Google Scholar]
- Pfeffer, J., Krujissen, J. M. D., Crain, R. A., et al. 2018, MNRAS, 475, 4309 [NASA ADS] [CrossRef] [Google Scholar]
- Piffaretti, R., Arnaud, M., Pratt, G. W., et al. 2011, A&A, 534, A109 [NASA ADS] [CrossRef] [EDP Sciences] [Google Scholar]
- Proctor, R. N., Forbes, D. A., Romanowsky, A. J., et al. 2009, MNRAS, 368, 91 [NASA ADS] [CrossRef] [Google Scholar]
- Puzia, T. H., Zepf, S. E., Kissler-Patig, M., et al. 2002, A&A, 391, 453 [NASA ADS] [CrossRef] [EDP Sciences] [Google Scholar]
- Racine, R. 1968, JRASC, 62, 367 [NASA ADS] [Google Scholar]
- Reina-Campos, M., Trujillo-Gomez, S., Deason, A. J., et al. 2022, MNRAS, 513, 3925 [NASA ADS] [CrossRef] [Google Scholar]
- Reina-Campos, M., Trujillo-Gomez, S., Pfeffer, J. L., et al. 2023, MNRAS, 521, 6368 [NASA ADS] [CrossRef] [Google Scholar]
- Rejkuba, M. 2012, Ap&SS, 341, 195 [Google Scholar]
- Renaud, F., Agertz, O., & Gieles, M. 2017, MNRAS, 465, 3622 [NASA ADS] [CrossRef] [Google Scholar]
- Richtler, T., Hilker, M., Kumar, B., et al. 2014, A&A, 569, A41 [NASA ADS] [CrossRef] [EDP Sciences] [Google Scholar]
- Robin, A. C., Reylé, C., Derrière, S., & Picaud, S. 2003, A&A, 409, 523 [NASA ADS] [CrossRef] [EDP Sciences] [Google Scholar]
- Schlafly, E. F., & Finkbeiner, D. P. 2011, ApJ, 737, 103 [Google Scholar]
- Schwarz, G. 1978, Ann. Stat., 6, 461 [Google Scholar]
- Sesto, L. A., Faifer, F. R., & Forte, J. C. 2016, MNRAS, 461, 4260 [NASA ADS] [CrossRef] [Google Scholar]
- Stein, P., Jerjen, H., & Federspiel, M. 1997, A&A, 327, 952 [NASA ADS] [Google Scholar]
- Stetson, P. B. 1987, PASP, 99, 191 [Google Scholar]
- Taylor, M. A., Puzia, T. H., Muñoz, R. P., et al. 2017, MNRAS, 469, 3444 [NASA ADS] [CrossRef] [Google Scholar]
- Urbano, M., Duc, P. A., Saifollahi, T., et al. 2025, A&A, 700, A104 [NASA ADS] [CrossRef] [EDP Sciences] [Google Scholar]
- VanderPlas, J., Connolly, A. J., Ivezic, Z., et al. 2012, 2012 Conference on Intelligent Data Understanding (IEEE) [Google Scholar]
- Vasiliev, E., & Baumgardt, H. 2021, MNRAS, 505, 5978 [NASA ADS] [CrossRef] [Google Scholar]
- Veljanoski, J., Mackey, A. D., Ferguson, A. M. N., et al. 2014, MNRAS, 442, 2929 [NASA ADS] [CrossRef] [Google Scholar]
- Veronica, A., Reiprich, T. H., Pacaud, F., et al. 2025, A&A, 694, A168 [NASA ADS] [CrossRef] [EDP Sciences] [Google Scholar]
- Walker, S. A., Fabian, A. C., & Sanders, J. S. 2013, MNRAS, 435, 3221 [NASA ADS] [CrossRef] [Google Scholar]
Appendix A: Catalog of globular cluster candidates
Properties of the GC candidates in Field 1 of the Centaurus cluster.
Appendix B: Parameters of the galaxies and of their GCSs
Parameters of the galaxies NGC 4696, NGC 4706, WISEA J124956.33-411536.8, and ESO 323-G 009.
Shape of the GCSs of the galaxies in Tab. B.1.
Appendix C: Color-magnitude diagram
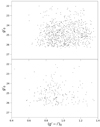 |
Fig. C.1. Comparison between the color-magnitude diagram of the GC candidates of NGC 4709 and that of the region between NGC 4709 and NGC 4696. Top panel: Color-magnitude diagram of the 785 GC candidates within a galactocentric distance of 5 × reff from the center of NGC 4709. Bottom panel: Color-magnitude diagram of the 202 GC candidates in the ∼20.89 arcmin2 region between NGC 4709 and NGC 4696. |
Appendix D: Color distributions
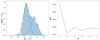 |
Fig. D.1. Bayesian Information Criterion in Field 1. Left Panel: probability density function vs the (g′−i′)0 color. The black line represents the best-fit model, and the dashed lines represent the Gaussians described by the model. The color distribution is divided in bins according to the Freedman-Diaconis rule (Freedman & Diaconis 1981). Right panel: values of the BIC as a function of the number of components in the model. |
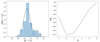 |
Fig. D.2. Akaike Information Criterion test on the GC candidates in the region between NGC 4709 and NGC 4696. Left panel: probability density function vs (g′−i′)0 color. The black line represents the best-fit model, and the dashed lines represent the two Gaussians described by the model. The color distribution is divided in bins according to the Freedman-Diaconis rule (Freedman & Diaconis 1981). Right panel: values of the Akaike Information Criterion (AIC) as a function of the number of components in the model. |
Parameters of the color distributions for the galaxies in Tab.B.1, and for the region between NGC 4709 and NGC 4696.
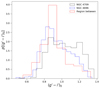 |
Fig. D.3. Comparison of the color distributions. The plot shows the probability density function (p[(g′−i′)0]) as a function of the (g′−i′)0 color for NGC 4709 (black line), NGC 4696 (blue line) and the rectangular region between them (red line) shown in red in Fig.3. The three color distributions are normalized so that the area of each histogram is equal to 1. |
Appendix E: Luminosity function of the region between NGC 4709 and NGC 4696
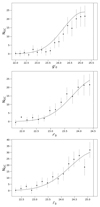 |
Fig. E.1. GCLF of the region between NGC 4709 and NGC 4696. Top, Middle, and Bottom panels: GCLF in the g′0, r′0, and i′0 bands, where the black dots represent the number of clusters corrected for the completeness fraction and for the background level divided in bins of 0.2 mag, and the solid line represents the best-fit Gaussian. The dashed lines show the magnitudes at which we have a 67% completeness. |
Best-fit parameters for the GCLF of the region between NGC 4709 and NGC 4696.
Appendix F: X-ray contours
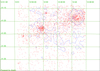 |
Fig. F.1. X-ray contours. The plot shows the positions of the GC candidates obtained in this work (red dots) compared to the X-ray contours obtained from eROSITA (blue lines). The X-ray contours were obtained from data by Veronica et al. (2025). The plot was made using Aladin4 (Bonnarel et al. 2000; Boch & Fernique 2014). |
All Tables
Properties of the models of the surface brightness distribution of NGC 4709 in the i′ band.
Parameters of the galaxies NGC 4696, NGC 4706, WISEA J124956.33-411536.8, and ESO 323-G 009.
Parameters of the color distributions for the galaxies in Tab.B.1, and for the region between NGC 4709 and NGC 4696.
All Figures
|
Fig. 1. Centaurus cluster. The image shows the four fields obtained during the observation. The field-of-view is of 1 × 1 deg2, which corresponds to 0.742 × 0.742 Mpc2, with the north pointing in the upward direction and the east in the leftward direction. The green line delimits the region of ∼8.795 × 11.494 arcmin2 we analyzed in Federle et al. (2024), whereas the blue line represents the region of 26.91 × 26.40 arcmin2 analyzed in this work (Field 1). |
| In the text | |
|
Fig. 2. Comparison between the color magnitude diagram of the target field and that of the background region. Top panel: Color-magnitude diagram of the 18 651 sources (black dots) selected according to their shape. The plot shows the g′0 magnitude as a function of the (g′−i′)0 color. The red dots represent the sources after the selection on colors and magnitudes. Bottom panel: Color-magnitude diagram of the background region. The plot shows the g′0 magnitude as a function of the (g′−i′)0 color for the 1639 compact sources (8.79% of the total sources in Field 1) located in the rectangle region of 11.10 × 6.95 arcmin2 (11.87% of Field 1) used to calculate the background level (see green rectangle in Fig. 3). |
| In the text | |
|
Fig. 3. Positions of the GC candidates with respect to the center of the galaxy. The plot shows the declination and right ascension of the sources, where the center of NGC 4709 (blue point) is located at (Δδ, Δα)=(0, 0). The blue circle defines the limit used to define the GCS of NGC 4709. The green rectangle represents the ∼77.22 arcmin2 region where the contamination level from background objects was calculated, the cyan point is the position of the center of NGC 4696, and the red rectangle is the ∼20.89 arcmin2 region between NGC 4709 and NGC 4696 for which we calculated the luminosity function in Sect. 7. The field-of-view is of 26.91 × 26.40 arcmin2. |
| In the text | |
|
Fig. 4. Completeness test. The plot shows the completeness fraction as a function of the g′0 magnitude for the artificial stars added in the three filters inside a galactocentric radius of 5 × reff (black line), for the artificial stars inside the rectangular region used to estimate the background contamination (green line), and inside the region between NGC 4709 and NGC 4696 (red line) represented by the red rectangle in Fig. 3. The dashed lines show the 50% completeness limit. |
| In the text | |
|
Fig. 5. Bayesian Information Criterion test on the GCS of NGC 4709. Left panel: Probability density function versus (g′−i′)0 color. The black line represents the best-fit model, the dashed lines represent the two Gaussians described by the model. The color distribution is divided in bins according to the Freedman-Diaconis rule (Freedman & Diaconis 1981). Right panel: Values of the BIC as a function of the number of components in the model. |
| In the text | |
|
Fig. 6. Globular cluster luminosity function. Top, middle, and bottom panels: GCLF in the g′0, r′0, and i′0 bands, where the black points represent the number of clusters corrected for the completeness fraction and for the background level divided in bins of 0.2 mag, and the solid line represents the best-fit Gaussian. The dashed lines show the magnitudes at which we have 67% completeness. |
| In the text | |
|
Fig. 7. Globular cluster candidates density maps of the full Field 1. The plots show the density maps for the total (top panel), red (middle panel), and blue (bottom panel) GC populations, and the positions of NGC 4709 (diamond), NGC 4696 (triangle), NGC 4706 (inverted triangle), WISEA J124956.33−411536.8 (circle), and ESO 323-G 009 (leftward triangle). The field-of-view is of 26.91 × 26.40 arcmin2. |
| In the text | |
|
Fig. C.1. Comparison between the color-magnitude diagram of the GC candidates of NGC 4709 and that of the region between NGC 4709 and NGC 4696. Top panel: Color-magnitude diagram of the 785 GC candidates within a galactocentric distance of 5 × reff from the center of NGC 4709. Bottom panel: Color-magnitude diagram of the 202 GC candidates in the ∼20.89 arcmin2 region between NGC 4709 and NGC 4696. |
| In the text | |
|
Fig. D.1. Bayesian Information Criterion in Field 1. Left Panel: probability density function vs the (g′−i′)0 color. The black line represents the best-fit model, and the dashed lines represent the Gaussians described by the model. The color distribution is divided in bins according to the Freedman-Diaconis rule (Freedman & Diaconis 1981). Right panel: values of the BIC as a function of the number of components in the model. |
| In the text | |
|
Fig. D.2. Akaike Information Criterion test on the GC candidates in the region between NGC 4709 and NGC 4696. Left panel: probability density function vs (g′−i′)0 color. The black line represents the best-fit model, and the dashed lines represent the two Gaussians described by the model. The color distribution is divided in bins according to the Freedman-Diaconis rule (Freedman & Diaconis 1981). Right panel: values of the Akaike Information Criterion (AIC) as a function of the number of components in the model. |
| In the text | |
|
Fig. D.3. Comparison of the color distributions. The plot shows the probability density function (p[(g′−i′)0]) as a function of the (g′−i′)0 color for NGC 4709 (black line), NGC 4696 (blue line) and the rectangular region between them (red line) shown in red in Fig.3. The three color distributions are normalized so that the area of each histogram is equal to 1. |
| In the text | |
|
Fig. E.1. GCLF of the region between NGC 4709 and NGC 4696. Top, Middle, and Bottom panels: GCLF in the g′0, r′0, and i′0 bands, where the black dots represent the number of clusters corrected for the completeness fraction and for the background level divided in bins of 0.2 mag, and the solid line represents the best-fit Gaussian. The dashed lines show the magnitudes at which we have a 67% completeness. |
| In the text | |
|
Fig. F.1. X-ray contours. The plot shows the positions of the GC candidates obtained in this work (red dots) compared to the X-ray contours obtained from eROSITA (blue lines). The X-ray contours were obtained from data by Veronica et al. (2025). The plot was made using Aladin4 (Bonnarel et al. 2000; Boch & Fernique 2014). |
| In the text | |
Current usage metrics show cumulative count of Article Views (full-text article views including HTML views, PDF and ePub downloads, according to the available data) and Abstracts Views on Vision4Press platform.
Data correspond to usage on the plateform after 2015. The current usage metrics is available 48-96 hours after online publication and is updated daily on week days.
Initial download of the metrics may take a while.