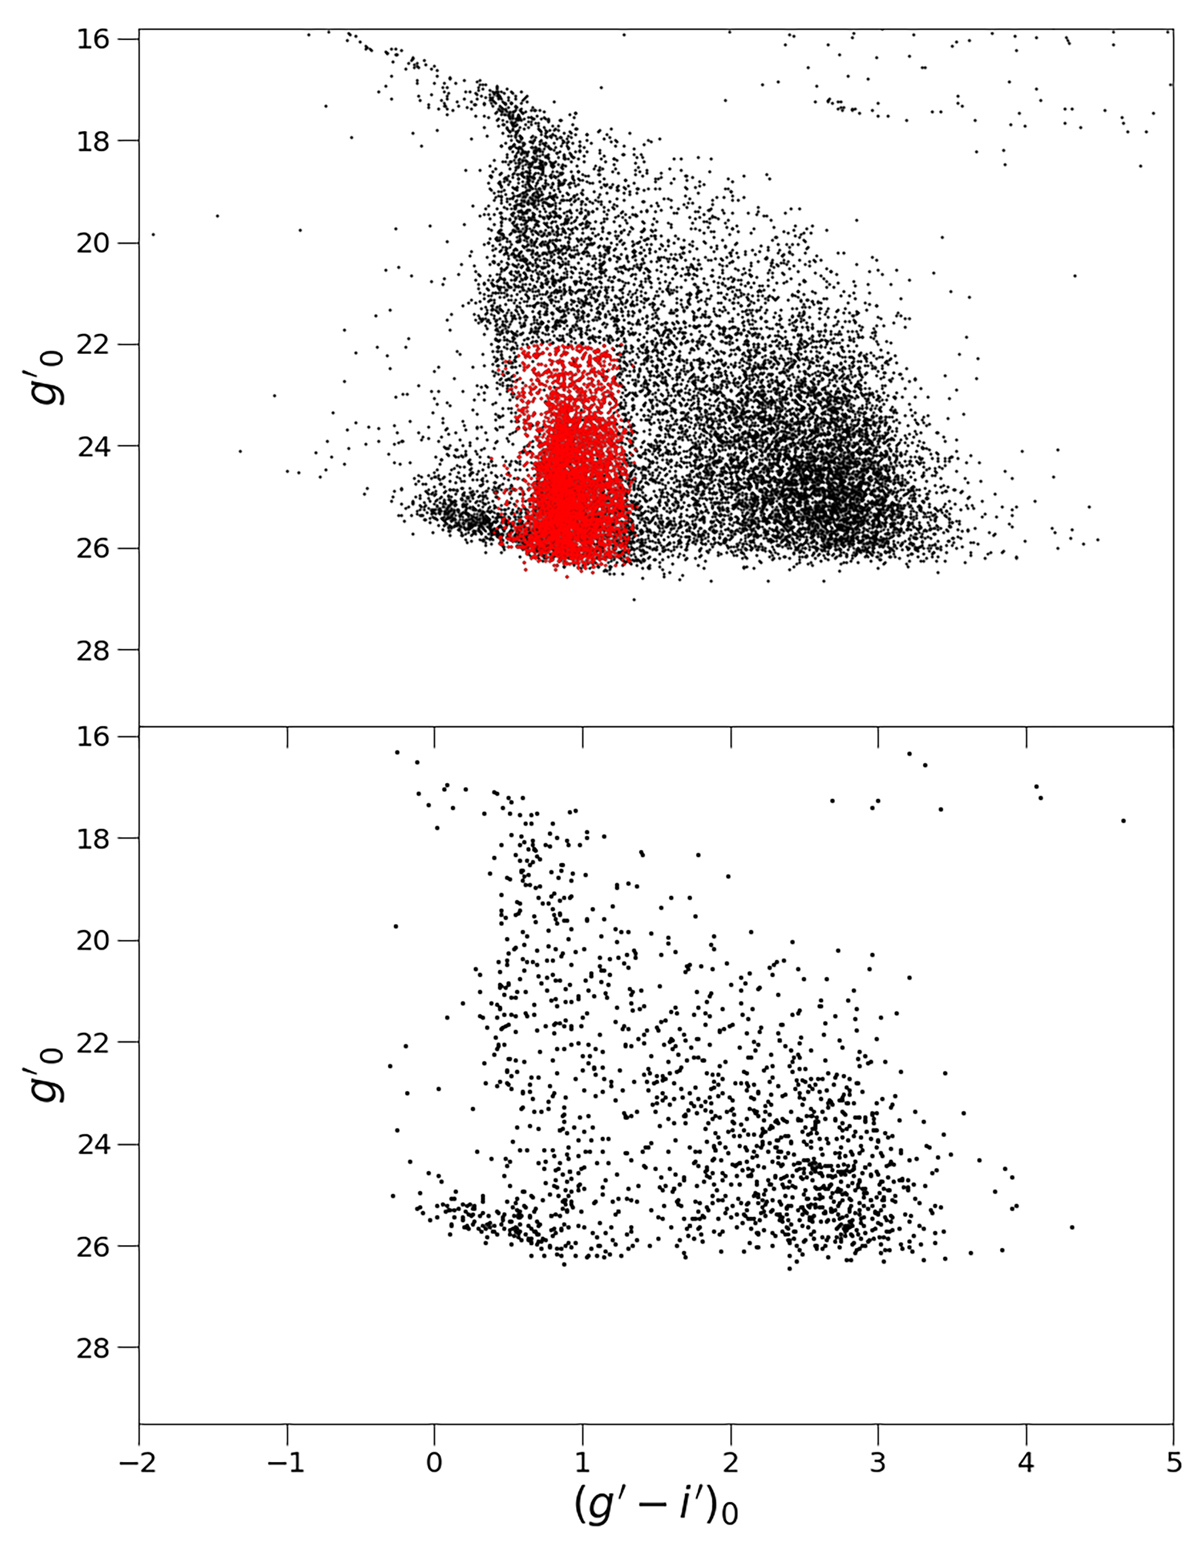
Fig. 2.
Download original image
Comparison between the color magnitude diagram of the target field and that of the background region. Top panel: Color-magnitude diagram of the 18 651 sources (black dots) selected according to their shape. The plot shows the g′0 magnitude as a function of the (g′−i′)0 color. The red dots represent the sources after the selection on colors and magnitudes. Bottom panel: Color-magnitude diagram of the background region. The plot shows the g′0 magnitude as a function of the (g′−i′)0 color for the 1639 compact sources (8.79% of the total sources in Field 1) located in the rectangle region of 11.10 × 6.95 arcmin2 (11.87% of Field 1) used to calculate the background level (see green rectangle in Fig. 3).
Current usage metrics show cumulative count of Article Views (full-text article views including HTML views, PDF and ePub downloads, according to the available data) and Abstracts Views on Vision4Press platform.
Data correspond to usage on the plateform after 2015. The current usage metrics is available 48-96 hours after online publication and is updated daily on week days.
Initial download of the metrics may take a while.